Journal #Thirteen [PRJ701] - Boosting Business Value
![Journal #Thirteen [PRJ701] - Boosting Business Value](/assets/images/prj701-j13.jpg)
Boosting Business Value
JOURNAL #THIRTEEN [PRJ701]
Boosting Business Value
Stitch Update & Insert
Several sprint items must be resolved by the data team from the previous sprint demo, one such item surrounded the ongoing discrepancy of the revenue figures converted to native currency. Before enacting changes to the method used to convert the currency rates, clarity was needed as to the extract and load process performed by Stitch, namely are new records inserted as part of the ETL process, or are updates to existing records also performed. The simplest way to do this was to create a low-value deal in the sales application and make adjustments to test whether changes were identified and updated. Testing was performed on the development environment, which updates daily. Once the new test deal was recognised, changes could be made and validated the following day. The test was incredibly beneficial as it validated the data and conclusively showed that the process performed updates in addition to inserts during data streaming. If these updates failed to occur, trust in the pipeline would have been lost and potentially a significant amount of work would be needed to change the architecture.
Currency Conversion API
A final decision has been made to load the required currency exchange rates directly into the data warehouse, this will act as a single source of truth for setting the rates at the start of each month. The rates in the data warehouse will be displayed on a dashboard in Tableau, which will be used and referenced by the sales operation team when inputting the figures into the sales application. There are three benefits to this solution, firstly, the rates displayed in Tableau can be used to validate the rates in the sales application, supporting quality control and ensuring consistency, secondly, the rates will be loaded automatically in the data warehouse, reducing the manual process currently occurring, and thirdly, it will resolve small rate discrepancies that are currently occurring in the data warehouse, leading to small figure discrepancies in the data warehouse that is obvious at a monthly level, but becomes more pronounced when aggregated quarterly and yearly.
The initial thought was to use the Snowflake marketplace to integrate the relevant data directly into the company’s environment. After contacting several providers, the cost-benefit didn’t add up given the business requirements and the limited, albeit important necessity to store the information. A decision was made to load this data through an API, a preferable solution despite the need to allocate extra resources to the process, the cost is significantly lower and better reflects the small data set required.
Several API integrations have been tested offering the same solution, however, ExchangeRateAPI.io was chosen after consideration was made to the geolocation of the company, being inside the EU, and the privacy stance in terms of their compliance with GDPR and the rights of data subjects as defined. ExchangeRateAPI.io is a JSON based REST API maintained by apilayer, headquartered in Vienna, Austria.
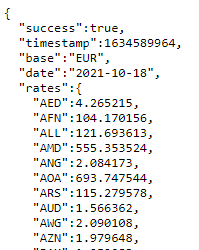
Once the account was created a unique personal access key was generated that can be used to access and query the API, the extent to which the API can be queried is dependent on the account subscription. The account setup and subsequent queried exchange rates are shown in the following images.
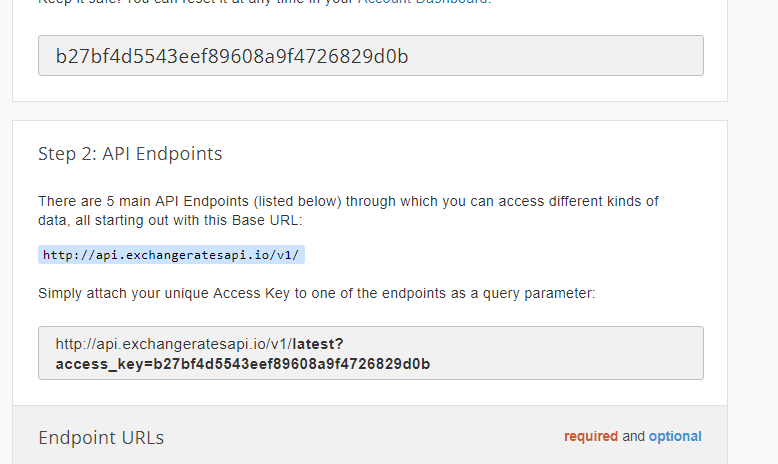
The paid subscriptions provide several endpoints offering different functions:
- Latest rates in real-time for all or a specific set of currencies
- Any conversion of one currency to another
- Historic rates for all or a specific set of currencies
- Historic rates between a date period for all or a specific set of currencies
- Fluctuation rate data between a date period for all or a specific set of currencies
Once the integration with the API is complete, the development of the Tableau exchange rate dashboard can begin. Given the user requirements and use case, the data may be best displayed as a table containing all historical records that can be referenced by the sales operation team.
Insights with Time Tracking Metrics
Part of the wider high-level OKRs requires that the data team track five metrics relating to team efficiency, these metrics are identified as follows:
- Number of data requests
- Time to integrate new data source
- Time to create a new report
- Turnaround time on requests
- Job error rate
Management stakeholders have requested the team look into possible frameworks to track these metrics. The preferred solution would be to integrate a time-tracking add-on for Jira Service Management (JSM) tasks, which can be used by the team when implementing technical requirements together with ticket labels to track the type of task being worked on. Several tools have been investigated with consideration made to features, integration, cost, security, and privacy. A service request has been made to install a free trial into the existing JSM environment. Once approved, testing can begin.
One challenge has, however, been identified. Data requests are currently created, progressed, and tracked through a JSM service request portal that is independent of the Scrum board utilised by the data team. To effectively track these requests and the other tasks that make up wider team efforts, it is preferred that these are all managed in the data team Scrum board. Transferring request tickets from one board to another is possible and this process has previously been completed for another business department for another project, a refresher will be needed that will include a review of the documentation to ensure that tickets from the request board portal can be moved from their current state to the item structure in the Scrum board. The complexity of the transfer, if it is possible, won’t be fully known until the ticket structure in both boards is analysed.
Building on insights in Tableau
There has been a significant progression in this sprint, moving from managing challenges in the data pipeline to focusing on how the team can improve and increase the insights generated from the relatively limited data set currently available. More effort is being focused on new data dashboards that can be accessed by each member of the sales team to view targets against current generated sales. This comes with further challenges, namely because targets are attached to salaries that are private to each sales representative. A dashboard must be created that allows management stakeholders to gain a complete picture of each sales representative, whilst allowing access to those sales representatives with the ability to see only their sales target, and not the targets of other sales representatives.
Security Considerations
The private sales representatives targets and production release of the company dashboard, have necessitated security to be placed on the production-ready data. This is essential as the production data is the environment that is updated in near real-time, every 30 minutes. Development data is updated once overnight to reduce costs associated with the extract and load process.
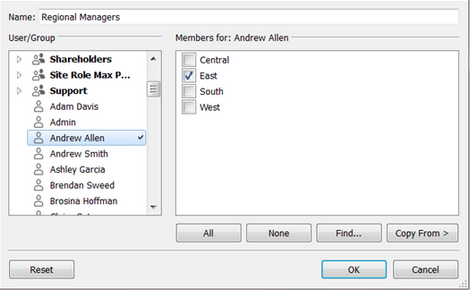
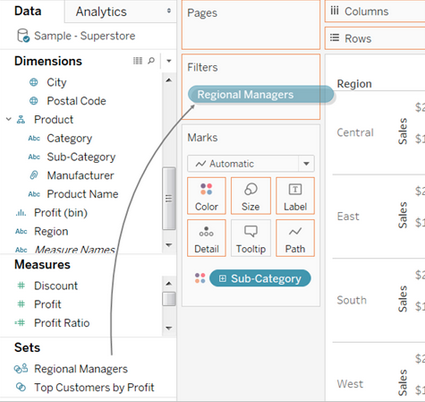
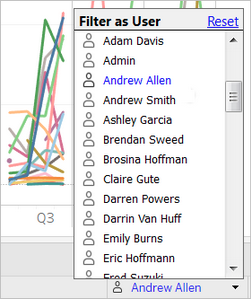
The first step was to investigate ways to secure sales representatives targets from the dashboard, the team did not want was a complete dashboard for management, with separate dashboards for each sales representative, shared exclusively with that sales representative. This would require new dashboards to be created each time a new sales representative was employed by the company. Reading the Tableau documentation provided a Row Level Security (RLS) solution that deployed user filtering, this allows rows to be made visible only to specific users. A test chart was created against the data set and rows selected and filtered to two members of the data team, the feature was tested in the desktop application first by toggling between the users, once the test was confirmed it was published to the cloud environment for a final check. Both teams members accessed their online instances and confirmed that the change had taken effect.
The benefit of securing the data using RLS is that only one dashboard is necessary and can be fully automated, meaning that when a new sales representative is employed, or a team member leaves, the charts will update automatically. The only task required will be the application of RLS for new sales representatives when they are set up with a new account.
The CTO would like to use the next demo to display the developed dashboards to management level stakeholders, to ensure accurate data the dashboards must be migrated from using the development environment to the production environment. Production is being used exclusively for Tableau and is secured using IP security whitelisting. Currently, the IP is set to the Tableau cloud instance, which has led to problems with this setup.
In the initial comparative analysis Tableau fell short on its integration process, requiring a desktop application to integrate with data sources before being published to the cloud environment, this meant that a connection could not be made through the company’s office router. Despite being a simple fix by whitelisting the office router IP address, this increases the attack surface area and validates the initial requirements to deploy an entirely cloud-based service. As the necessity for other users increases, deploying the desktop version in more locations across the globe will require increased management to maintain the security of the data. This could be further exacerbated for those users that are remote-based and look to connect from multiple locations. One solution may be to only allow cloud access in these instances, however, not all features are available in this version.
APILayer - Privacy Policy. (n.d.). Retrieved October 23, 2021, from https://www.ideracorp.com/Legal/APILayer/PrivacyStatement
Best Practices for Row Level Security. (n.d.). Retrieved October 23, 2021, from https://help.tableau.com/current/server/en-us/rls_bestpractices.htm
Create a User Filter and Secure it for Publishing. (n.d.). Retrieved October 23, 2021, from https://help.tableau.com/current/pro/desktop/en-us/publish_userfilters_create.htm
Documentation - Exchange Rates API. (n.d.). Retrieved October 23, 2021, from https://exchangeratesapi.io/documentation/
Exchange Rates API. (n.d.). Retrieved October 23, 2021, from https://exchangeratesapi.io/