Journal #Ten [PRJ701] - Business Insights
![Journal #Ten [PRJ701] - Business Insights](/assets/images/prj701-j10.jpg)
Business Insights
JOURNAL #TEN [PRJ701]
Business Insights
Data Team Sprint Demo
The demo meeting presented two main elements of the project to the stakeholders:
- Close to accurate and complete sales and revenue data in the Data Warehouse
- The dashboard created in Tableau displaying the global sales and revenue data
As stated the data is close to production-ready, which allowed the work conducted on the dashboard to display reasonably accurate data. The dashboard shows the current and up to date monthly sales as a dollar figure, a bar chart showing the current sales revenue against the monthly target figure, and the month by month sales revenue for 2020 and 2021 including recurring revenue contractual due for the next quarter of 2021. The dashboard is branded so it is identifiable as part of the corporate IT ecosystem.
Problems Encountered
As the team has moved closer to producing accurate data the identification of anomalies becomes more difficult to uncover, usually requiring a solution that is more complex or time consuming for the degree of extra accuracy that is gained. This is a familiar process having a finance background, so it was anticipated. Many of the issues are a result of input errors from users of the sales system, which are an easy but time-consuming fix. Rules will be implemented in the data warehouse to prevent these errors from impacting the data set.
The iterative nature of a Scrum methodology led to the creation of a dashboard that was produced in time for the demonstration. To achieve this the visualisations were generated using fixed filters, for instance, where year, month, or quarters represent the axis of a chart. This is a temporary working solution that will require the manual adapting of the charts at the beginning of each new month, quarter and year, this must be improved through automation by creating calculations that base the charts on today, and work from that as a base point.
One of the sprint items was the recreation of a Google Analytics dashboard in Tableau bringing data visualisations into one ecosystem. This was started late in the sprint due to other commitments from this project, and peripherally related tasks associated with data privacy and security that are an organisational requirement, particularly as this project is occurring in tandem with a SOC-2 security audit. Furthermore, the dashboard was not created from data ingested into the data warehouse but from the relational OLTP database directly. This is a large and unfamiliar database that took a reasonable amount of time to map from the Entity-Relationship Diagram (ERD), in addition to understanding and interpreting the naming conventions. Ultimately, the dashboard was unavailable for the sprint as a result. This was not a great concern. It was decided that this sprint item can be moved to the backlog, its importance to stakeholders is diminished due to the pace of progress relating to the sales and revenue data, and resources would be better served elsewhere. The team will return to this once the operational production data has been ingested into the data warehouse.
Progress has been delayed with the implementation of alerts and notifications, conflicting schedules have meant that a meeting with the team a Tableau is yet to be set. The process is simple, however, the official documentation suggests that a license is required before alerts can be set up, currently, the team is using a trial account which was extended this week. Clarity should be gained when a meeting can be arranged.
Goals
There are several team level and individual level goals in the forthcoming sprint:
- Amend the sales and revenue charts so the dashboard is fully automated, or automated to a sufficient degree that it requires minimal maintenance
- Understand the set-up process for alerts and notifications and discuss the requirements with the data team, i.e. what are the triggers for alerts
- Include financial data that is currently sent to stakeholders in regular emails, to include the following tables and charts:
- Current monthly revenue breakdown by region
- Revenue split into direct sales revenue, partner revenue and total revenue
- Revenue against target and percentage achieved for the month
- Three monthly revenue to date split by region and relating to the current quarter
- Total revenue from current quarter compared to quarterly targets
- Percentage revenue achieve against revenue for the quarter
- Total bookings revenue for each month of the current year by region
- Visualise this data in a chart grouped by the monthly revenue by region
- Create a partner paid revenue table
- Work with the interdisciplinary team to define the sales categories if a deal is partner paid
Tableau Automation
To protect company confidentiality the outcome of the automation process will not be displayed in this journal, however, the code deployed to create the calculations is listed. The code used to create the automation is based on the documentation standards as follows:
-
Calculation for today’s sales
IF [Order Date]=TODAY()

THEN [Sales] END -
Calculation for the current month’s sales
IF DATETRUNC('month',[Order Date])=DATETRUNC('month',TODAY())

AND DAY([Order Date])<=DAY(TODAY())

THEN [Sales] END -
Calculation for last month’s sales
IF DATETRUNC('month',[Order Date])=DATETRUNC('month',DATEADD('month',-1,TODAY()))

THEN [Sales] END
The first step in the automation process was to collect all revenue for the current month based on the current date, this code allows for the total monthly sales revenue and revenue tracker to auto-adjust when a new month begins.

Secondly, code was developed to visualise all sales from the current year and the previous year, the date month name was then used to split the sales by month. Currently, this is adding the sales by month combining the years, and not splitting by each year, this will require further work.
To get the sales for the current and previous year separately, in two separate bar charts, the following code has been deployed.

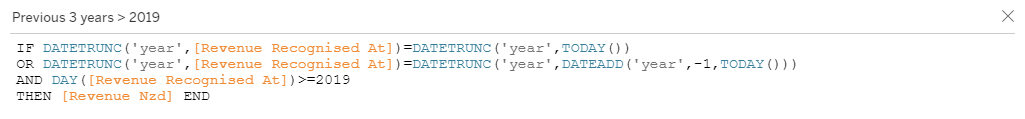
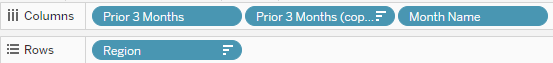
The final calculation collates the months in the current quarter, this is used to prepare the chart to allocate the calculation into the columns. Despite the documentation indicating this to be the preferred solution, changes are likely to be made that use the quarter fields in the dim_date table to get the current quarter information. The reason is this calculation will produce quarters going back from the current month and not the defined financial quarter, for example, the next financial quarter is Oct, Nov, Dec, this calculation will produce the quarter as Aug, Sep, Oct, producing incorrect figures.

The next immediate steps are to resolve the automation issues and re-create the chart headings so they automatically display the current month. Once these are resolved work can move to connect a Google Sheet directly into Tableau that contains the monthly sales targets.
Creating a Title that Automatically Displays Today’s Date - Tableau Software. (n.d.). Retrieved September 30, 2021, from https://kb.tableau.com/articles/howto/creating-a-title-that-automatically-displays-today-s-date
How To Show Sales of Today, This Month, Last Month in One Table - Tableau Software. (n.d.). Retrieved September 30, 2021, from https://kb.tableau.com/articles/howto/How-To-Show-Sales-of-Today-This-Month-Last-Month-in-One-Table
Tableau Tip. (2018, November 11). Tableau—Prior 3 Months - Previous 3 months calculation - Datediff function use case. https://www.youtube.com/watch?v=_8jNF61eSt4