Journal #Nine [PRJ701] - Data Validation
![Journal #Nine [PRJ701] - Data Validation](/assets/images/prj701-j9.jpg)
Data Validation
JOURNAL #NINE [PRJ701]
Data Validation
Insights through Visualisation
The project scope requires the creation of analytic data visualisations that offer valuable business insights to stakeholders, this is one aspect of the goals that make up this sprint. To produce an end product the decision has been made on the business intelligence (BI) application that will be deployed, the trial instance of Tableau has been tested and connected to the data warehouse allowing fro the progression and creation of a dashboard that combines the following analytics:
- Current monthly sales revenue figure concerted to country currency
- Progress bar chart showing the current monthly sales against monthly revenue target
- Bar chart showing total monthly sales from January 2020 to date
It is important for the business that the visualisations are branded with the company logo, colours, and fonts. Adding branding elements such as the company logo and company colours was straightforward, fonts were however, slightly problematic and ultimately unsuccessful. The fonts had to be downloaded from Google Fonts and added to the font window before they could be deployed in the Tableau Desktop application. Unfortunately, once the dashboard was published to the cloud environment the font defaulted to Times New Roman. The cloud platform does not support the branded fonts and the options available are somewhat limited. There may be an alternative solution and this will be explored.
To meet the requirements of the sprint the dashboard was displayed on the monitors in the office and made available as slides. There are several solutions for displaying dashboard data, the solution deployed to meet current business need was simple but elegant. A generic company email was created that was used to set up a viewer account in Tableau, the dashboard was shared with the new account that could then be accessed through the large monitors and displayed to users. The benefit of this solution is it locks the information down to an account avoided the need to use a publicly available URL, meaning the data remains private, confidential, and internal to the company. The dashboard is exportable in several forms including as an image or PPTX file, Google Slides is deployed by the organisation and integration with this feature is being explored.
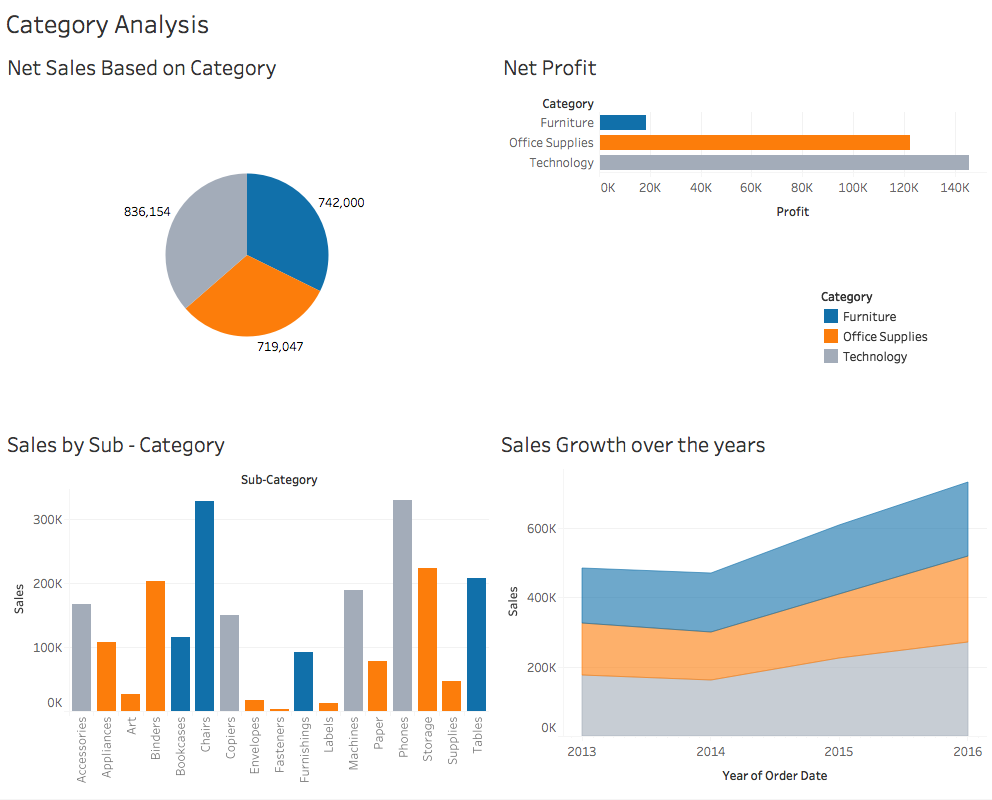
Although different from the actual dashboard produced for the project, excluded here for confidentiality reasons, the following image is an example sales and revenue dashboard that is capable of being produced in Tableau.
Identifying Anomalies
Creating the visualisations has involved query reporting in Snowflake, these exercises combined have confirmed data that is not yet being ingested into the data warehouse and identified unexpected issues with missing but expected data. This has contributed to the data validation process.
The first issue relates to the recurring revenue and how this can be stored in the sales application so it is available for extraction. This revenue has been defined and split into two distinct categories, simple revenue recurrence, i.e. evenly split over a set monthly period and complex revenue recurrence where the amounts vary month to month, sometimes skipping a month. The intention is to resolve this through the addition of an object field in the sales application that either defines the number of months, allowing for the recognised revenue to be divided evenly across the months beginning with the revenue recognised date, or the monthly amounts to be inserted in a comma separated format so they can be allocated to the relevant month in order. Months with no allocated revenue can either include a zero or null value before the comma.
An additional issues was identified from the data stream. Certain regional data is bulk added to the sales application, which doesn’t contain values for all fields, specifically the field that the data stream identifies for the extraction process. This is, however, a simple fix in the data warehouse. Once both of these issues are resolved the team should have, if no further anomalies are identified, a reliable source of truth for the revenue generated across the organisation.
Data Protection Impact Assessment (DPIA)
Wider organisational controls mean the General Data Protection Regulations (GDPR) must be considered for all data protection issues as a part of the principle of data protection by design and default. This requires organisations to implement appropriate technical and organisational measures to effectively safeguard the rights of data subjects. The organisation takes these obligations serious, leading to the completion of a DPIA being performed for this project.
Two triggers activate the requirement for a DPIA, either the data processing is likely to result in a high risk to data subjects, or the project is within the scope of organisational good practice for a major project such as this that requires the processing of personal data. Additional specific factors would trigger the legal requirement for a DPIA, however these fall outside the scope of the data collection and processing activities of the organisation, this can be read here in an earlier journal.
The DPIA is recorded in a custom issue created in Jira Service Manager, this acts as an audit log should it be required later by regulators or auditors. The DPIA includes the:
- Nature, scope, context and purpose of the data processing activities
- Necessity and proportionality of the processing and all compliance measures taken
- Identification and assessment of the risk to data subjects
- Identification of any further measures that can be implemented to mitigate the risks
The outcome of a DPIA will act as the comprehensive analysis of the data processing activities designed to identify and minimise the risks involved. These risks should not only cover those associated with the failure to meet regulatory compliance, but also the broader risks to data subjects. Consideration has been made to the potential for harm this might cause, be it physical and material or non-material harm either at the individual level, or to society at large.
The DPIA conducted for the project requires contribution from members of the technical personnel in the data team and wider technology team where management approval is a requirement. It is anticipated that the DPIA will be completed iteratively in line with the wider project, needing updates as the project progresses to ensure all risks are considered and the necessary steps are taken and documented to mitigate those risks.
Data protection by design and default. (2021, February 9). ICO. https://ico.org.uk/for-organisations/guide-to-data-protection/guide-to-the-general-data-protection-regulation-gdpr/accountability-and-governance/data-protection-by-design-and-default/
Data protection impact assessments. (2021, January 11). ICO. https://ico.org.uk/for-organisations/guide-to-data-protection/guide-to-the-general-data-protection-regulation-gdpr/accountability-and-governance/data-protection-impact-assessments/
Kaur, R. (2021, June 30). Best Free BI Software 2021 - Top Free Business Intelligence Tools. https://www.selecthub.com/business-intelligence/free-business-intelligence-tools/