Journal #Six [PRJ701] - Data Warehouse Architecture
![Journal #Six [PRJ701] - Data Warehouse Architecture](/assets/images/prj701-j6.jpg)
Data Warehouse Architecture
JOURNAL #SIX [PRJ701]
Data Warehouse Architecture
Data Team Sprint Demo
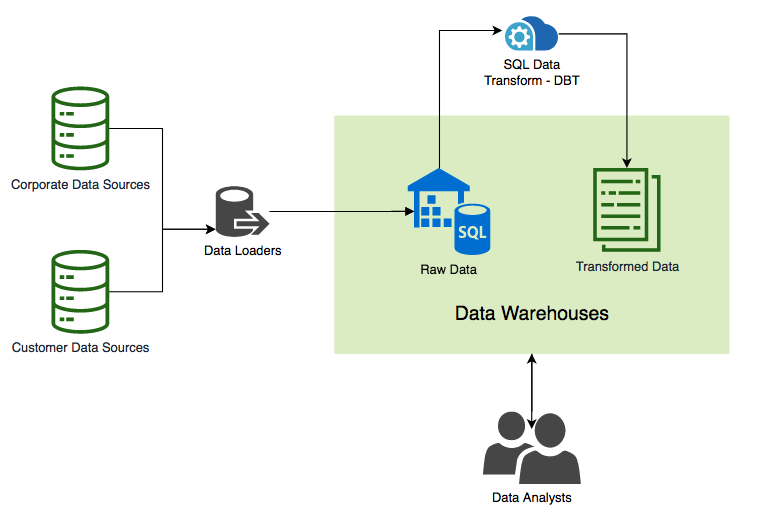
The primary focus of the Data Team Sprint Demo was the data pipeline architecture, explaining the process for all team members and stakeholders. Data extraction will be performed with different tools and deploy different methods based on the data source and loaded into the data warehouse. Transformation is carried out by the service provider DBT, which is discussed later in this journal. The data is transformed and then loaded back into the warehouse in its transformed form, making this an ELT pipeline.
The meeting objective shifted to how the current prototype architecture could be used to generate meaningful analytics over the coming fortnightly sprint, which would also act as a test and proof of concept for the prototype. The key result will be to connect two BI tools, in this case, Tableau and Qlik to answer a business question and test with non-technical users to assist the decision-making process.
The business question that will be answered is:
Snowflake Demo
A meeting took place with one of Snowflakes engineers who performed a run-through of some of the key features. The scope was to ingest raw data sets and prepare them to create data analytics in Tableau. The data source was publicly available and open-source offered by Citibike. For the purpose of the demo, the data was stored in an Amazon Web Services (AWS) S3 bucket and fed directly into Snowflake.
An initial overview presented some of the functionality that could be used to secure and protect data privacy including:
- Enabling each worksheet with a separate context
- Extra features when administration privileges are granted
- Ability to query queries
- Roll in S3 credentials when staging to an S3 bucket
- Create views that grant access to specific tables
- Create secure views that grant access to the results of the view only
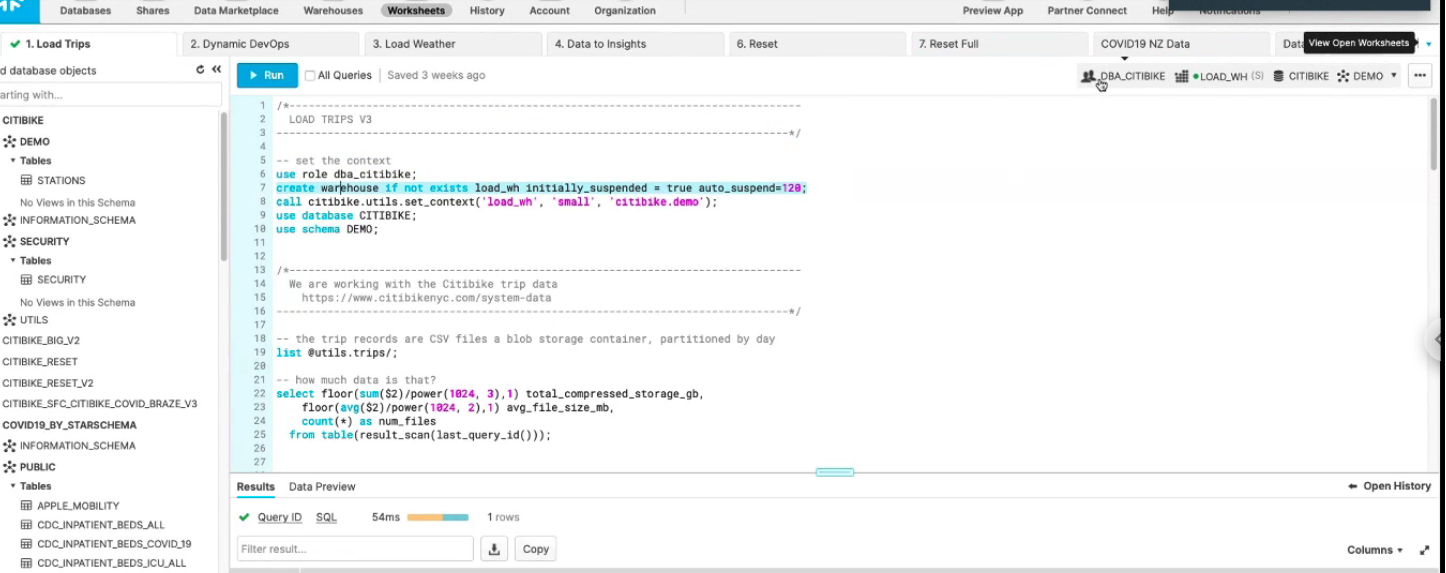
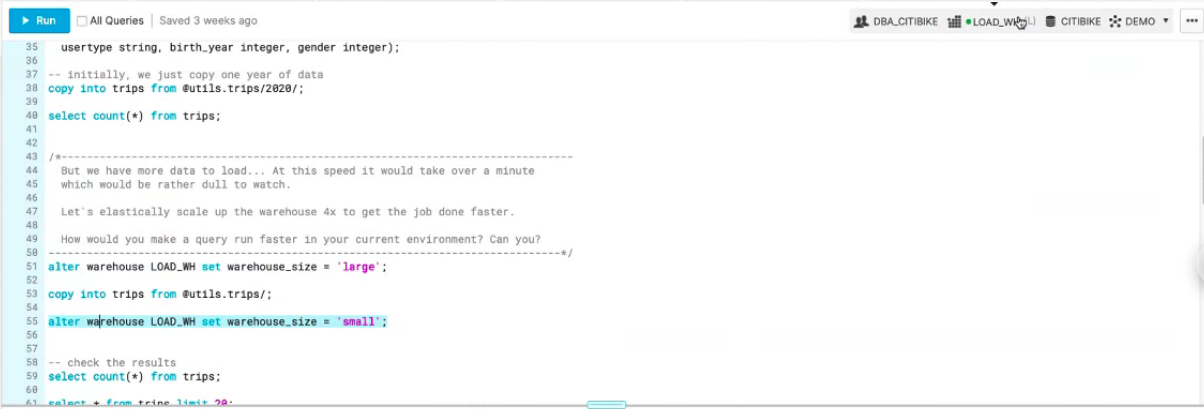
The demo began with basic SQL DDL that included establishing the data warehouse and applying settings including the minimum and maximum size of the cluster, the time to auto suspend and the time to auto-resume, this can help organisations to effectively manage costs associated with compute time. The size of the warehouse can also be altered on the fly to meet the operational requirements, any charge will only apply to the time used when an increase is applied.
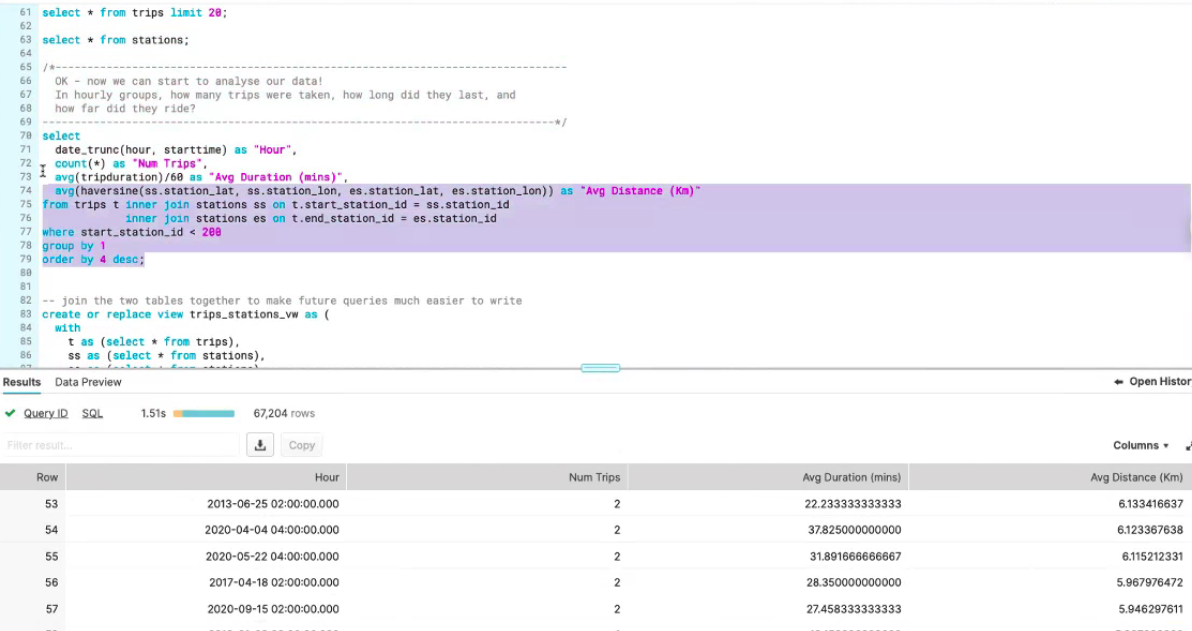
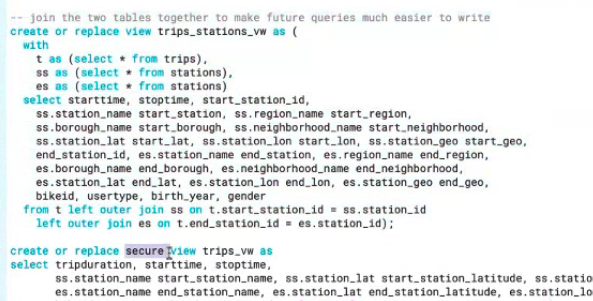
When data is available in the warehouse it can be queried. Before loading it into a BI tool and making it accessible to end-users a view is created that grants access to the tables required to run the query. If a greater level of security and privacy is required, for example, if the end-user is an external company a secure view can be created that prevents users from accessing the base table, meaning they are unable to access more information not explicitly produced by the query. The data is ready to be visualised in the BI tool, in this case, Tableau.
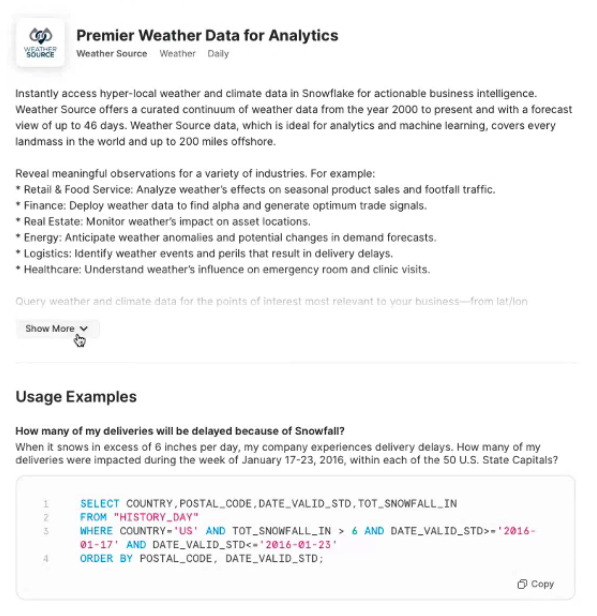
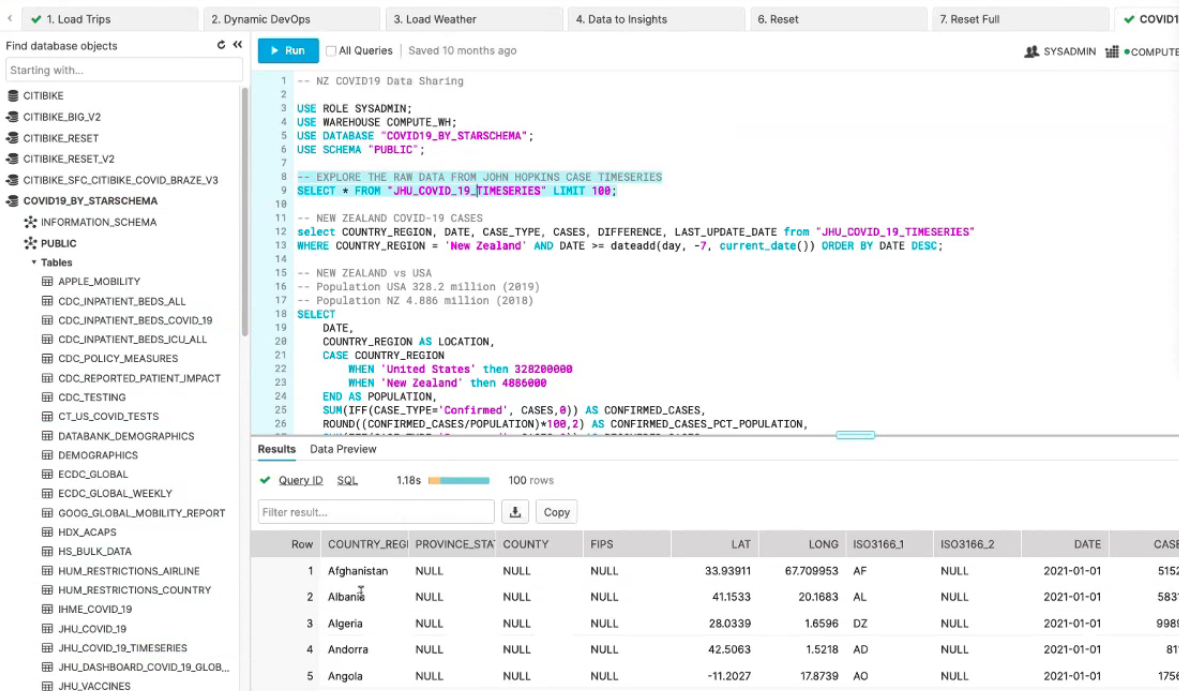
Snowflake includes a data marketplace where organisations can share data so it can be compared with your information, for example, weather data or Covid-19 cases data. For the demo weather data was ingested into the warehouse.
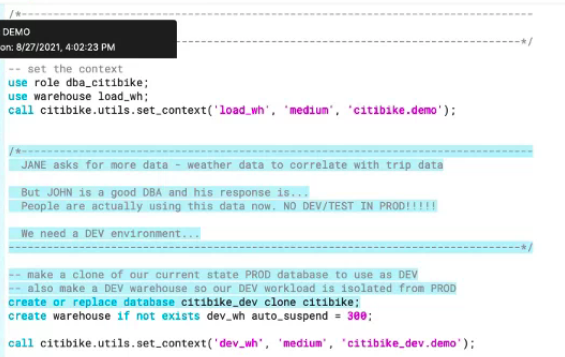
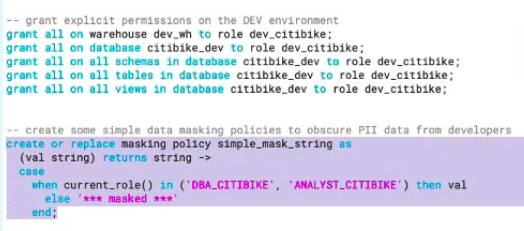
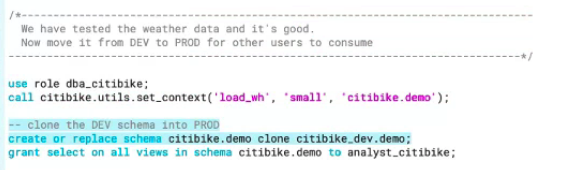
A clone of the production environment can be created, the development environment can then be used to test against without adversely impacting the production environment or limiting availability to end-users. The dev environment is not a full warehouse copy, instead, the metadata is copied and the pointers are separated from the production environment.
Permissions and policies can be created and tested against the dev environment such as the following column-level security masking policy, which is run as an SQL expression that specifies the rules. Masking hides the data from the end-users, anonymising it to support privacy and regulatory obligations. It’s possible to create one masking policy and then bind it to other tables, the policy can apply at the data warehouse level or schema level.
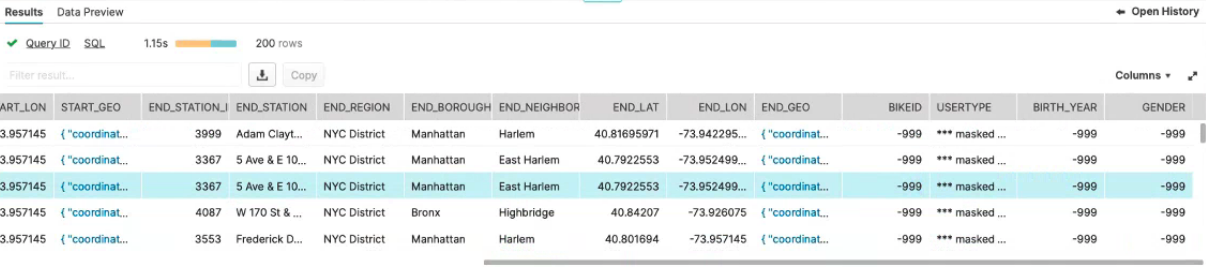
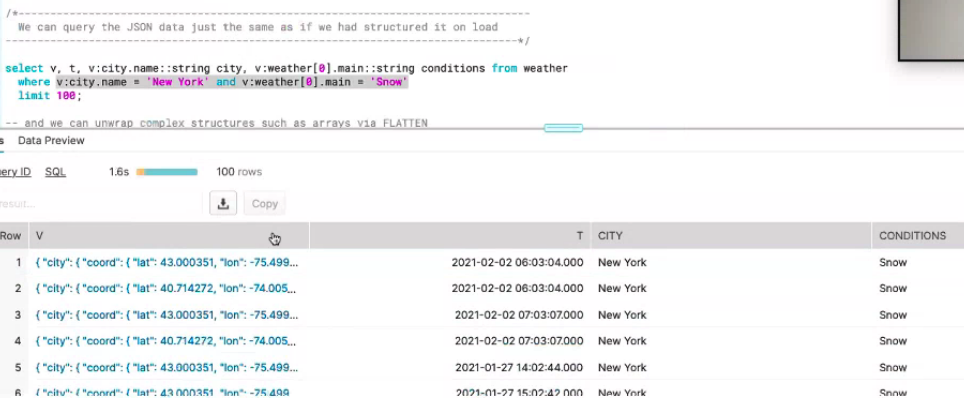
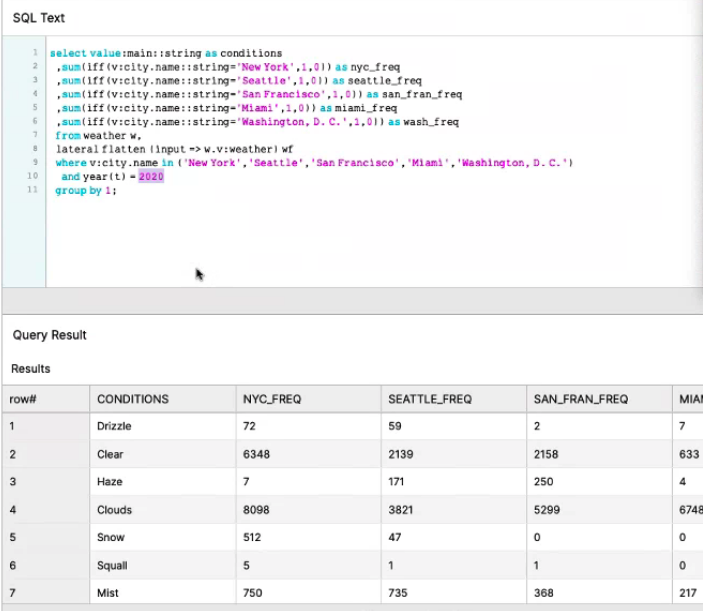
The ingested data is in JSON format. JSON data is columnarised by key values and compress into separate micro partitions, this allows for faster queries because micro partitions that don’t meet the where clause can be skipped. The query execution runs the query as a table scan because the data is micro-partitioned. JSON data can be unwrapped and the array flattened to make it available in a more structured way.
When the data in the dev environment is tested and ready, the table can be cloned to production, including any views, so there is no need for them to be run again. The dev clone can be dropped. Should further changes be required the dev clone can be recovered from Time Travel which is built into Snowflake.
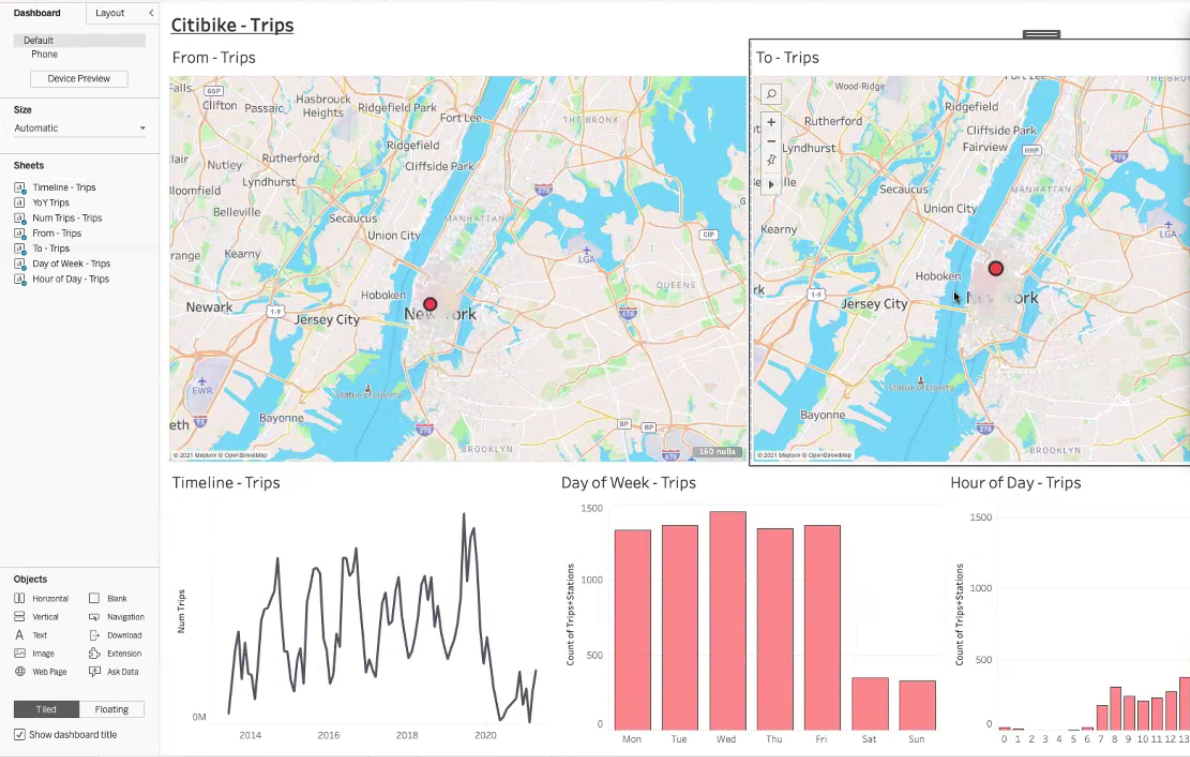
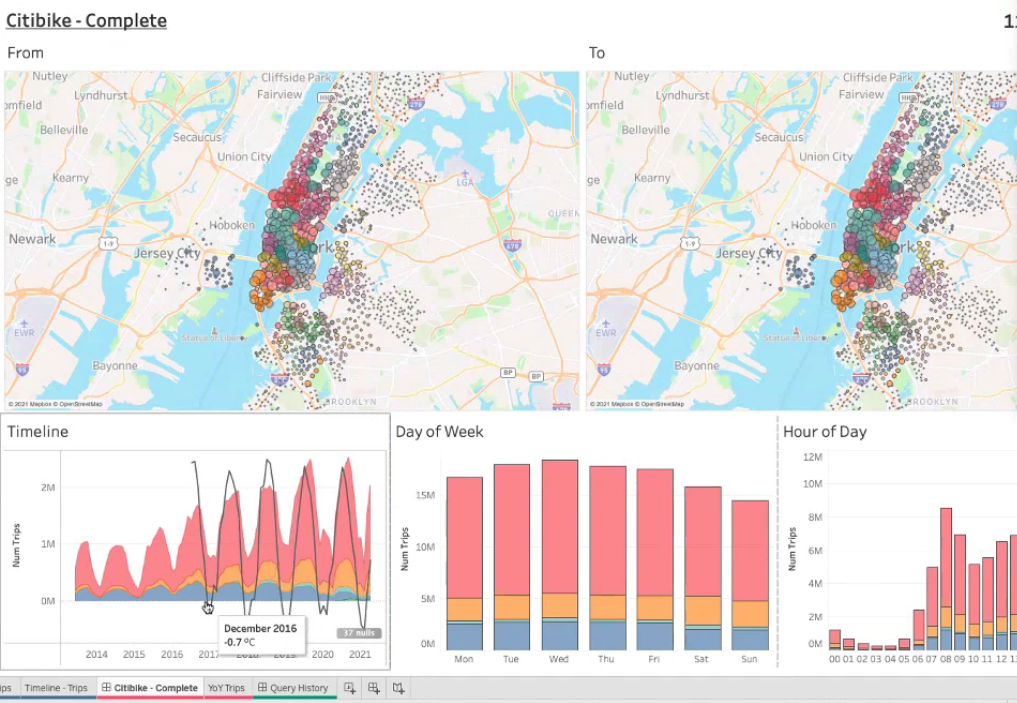
The final data analytics shows the comparison of bike usage against JSON weather data.
DBT | The 'T' in ETL
DBT (Data Building Tool) is a tool that allows data analysts and engineers to transform data in data warehouses using command-line select statements. In effect, DBT is being deployed in the data pipeline to perform the ‘T’ in the ELT architecture. DBT does not offer extract or load functionality, instead, it allows transformation to occur more efficiently by taking code, compiling it to SQL, and then running it against the data warehouse.
In addition to the command-line interface (CLI), DBT is also available as a more user-friendly UI. However, the CLI must be used to run tests, for compiling, and for generating documents. The UI is mainly used for the purposes of documentation.
DBT supports most databases including:
- Snowflake
- Postgres
- Redshift
- BigQuery
- Presto
Installation of DBT is through Python package installers (pip), both the CLI and UI are part of the package. The final benefit of DBT is that it is an open-source solution that allows for customisation to meet an organisation’s technical needs.
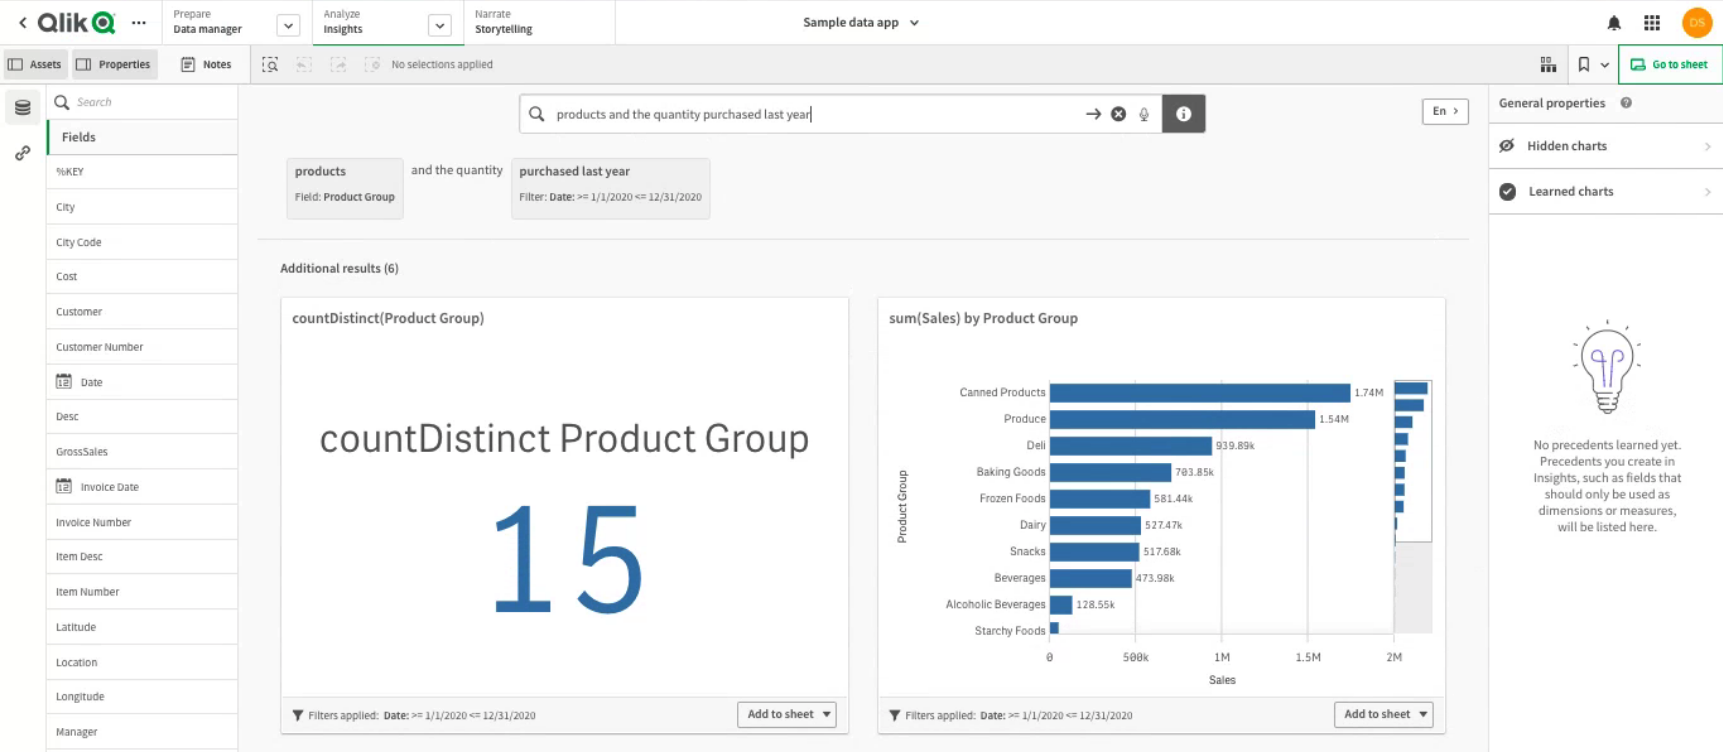
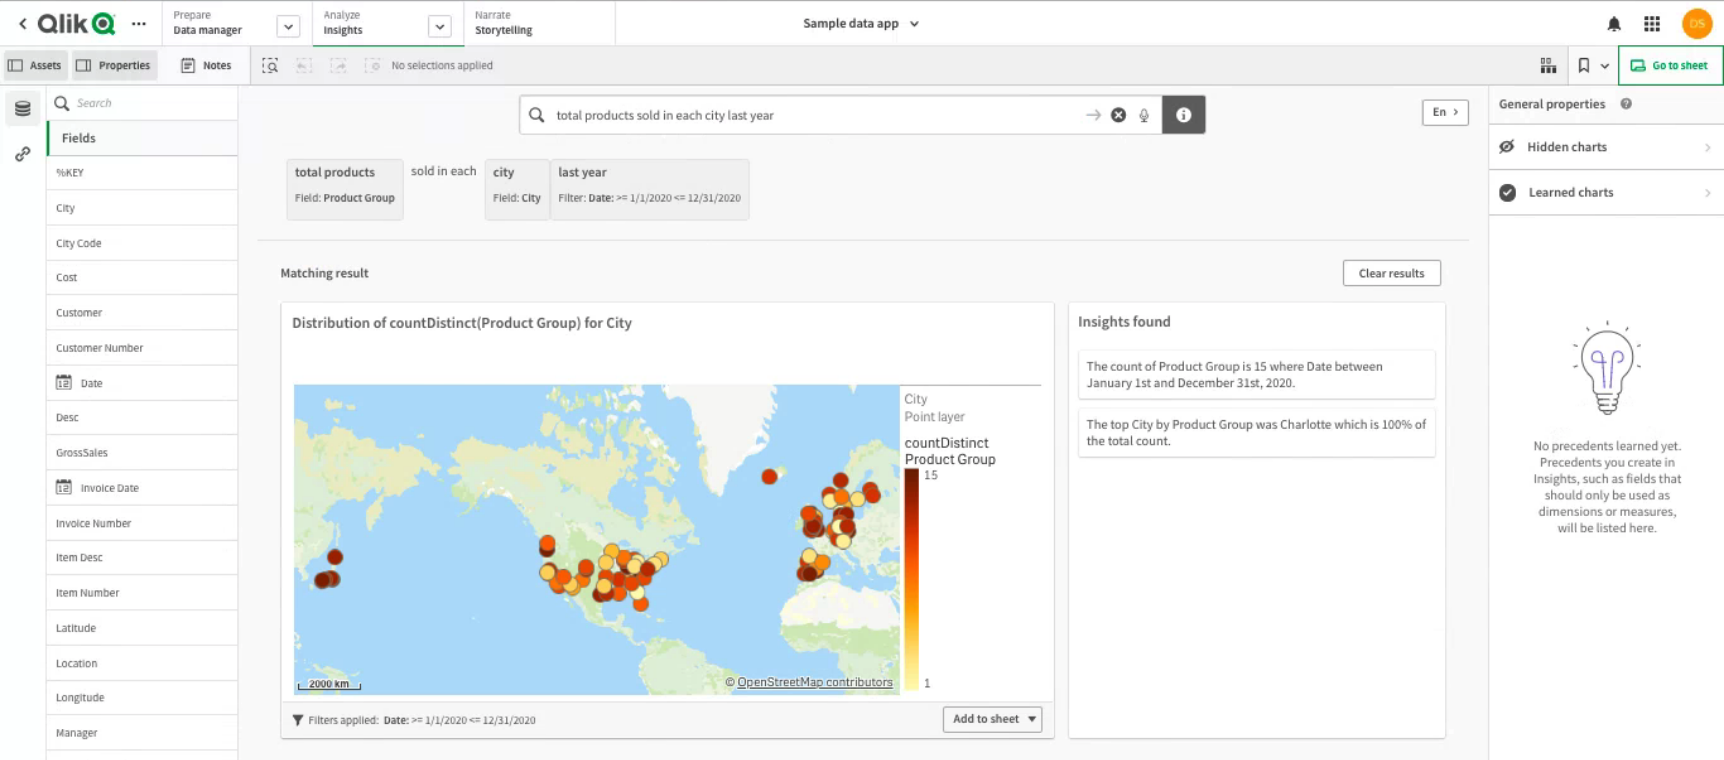
Qlik Data Analytics
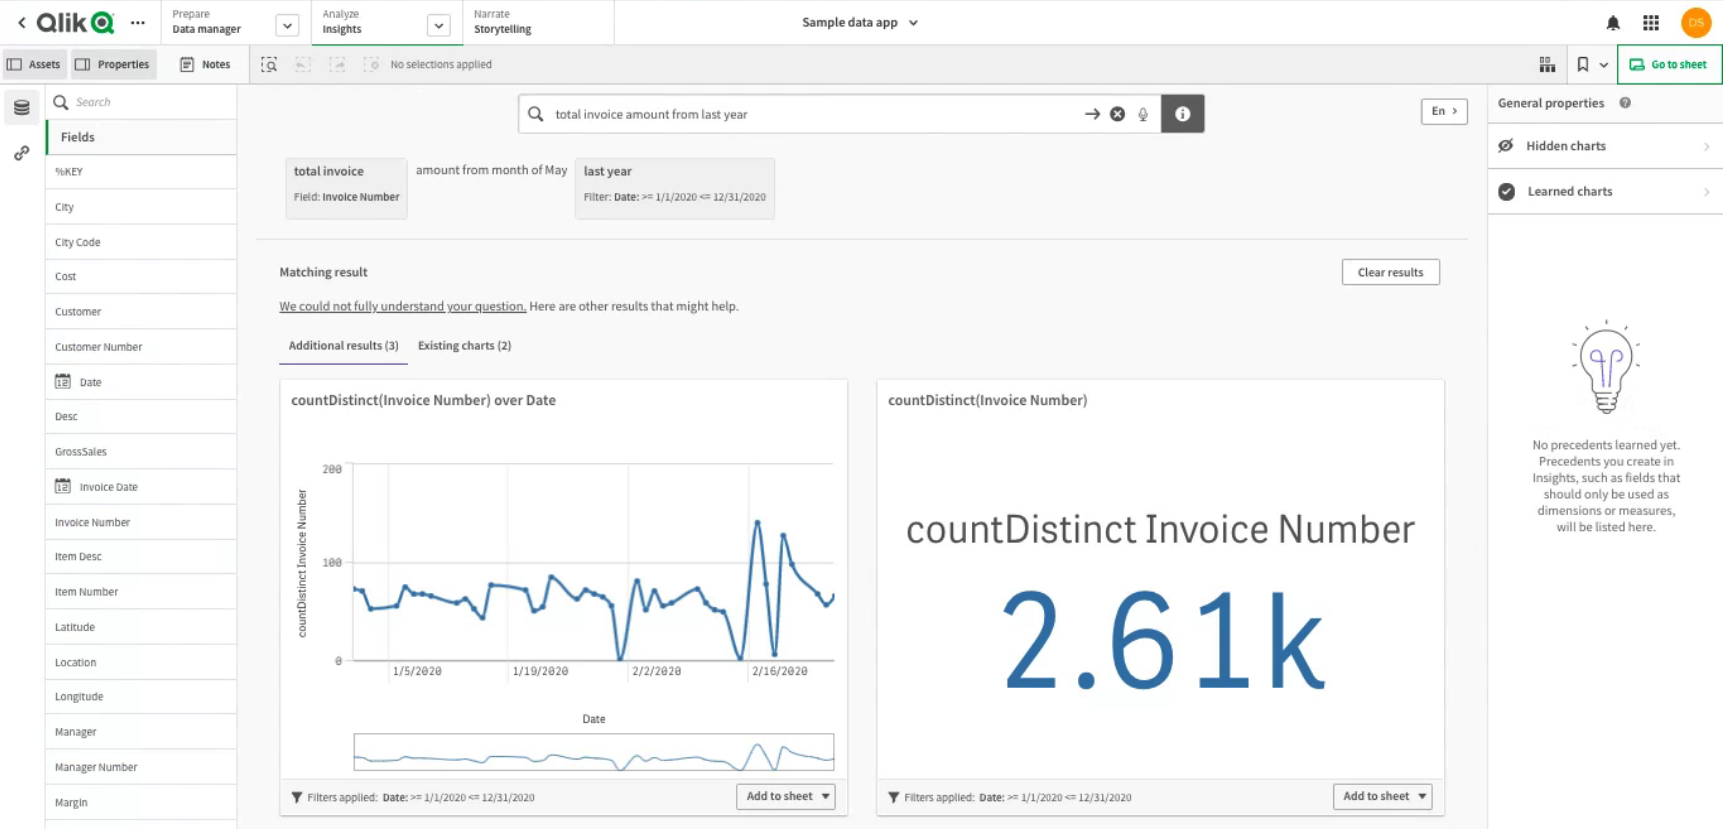
A further BI tool is being considered and tested for the forthcoming fortnightly sprint. Qlik takes a different approach to the other options tested, using plain language inputs combined with A.I. and machine learning technology to generate insights quickly. The interface is not as user friendly as some of the other options, however, the benefits might make the steeper learning curve worth the extra investment in time.
Connecting to data sources ‒ Qlik Sense on Windows. (n.d.). Retrieved September 2, 2021, from https://help.qlik.com/en-US/sense/May2021/Subsystems/Hub/Content/Sense_Hub/LoadData/connect-data-sources.htm
CREATE MASKING POLICY — Snowflake Documentation. (n.d.). Retrieved September 2, 2021, from https://docs.snowflake.com/en/sql-reference/sql/create-masking-policy.html
DBT: A new way to transform data and build pipelines at The Telegraph - by Stefano Solimito - The Telegraph Engineering - Medium. (n.d.). Retrieved September 2, 2021, from https://medium.com/the-telegraph-engineering/dbt-a-new-way-to-handle-data-transformation-at-the-telegraph-868ce3964eb4
Qlik - Data Analytics & Data Integration Solutions. (n.d.). Qlik. Retrieved September 2, 2021, from https://www.qlik.com/us/
Qlik Sense vs Tableau 2021—Feature and Pricing Comparison on Capterra. (n.d.). Retrieved September 2, 2021, from https://www.capterra.com/business-intelligence-software/compare/227048-209809/Tableau-vs-Qlik-Sense
Tableau vs Qlik Sense - Qlik Sense and Tableau Comparison. (2020, May 26). Analytics Vidhya. https://www.analyticsvidhya.com/blog/2020/05/tableau-vs-qlik-sense/