Journal #Two [PRJ701] - Data Team
![Journal #Two [PRJ701] - Data Team](/assets/images/prj701-j2.jpg)
Data Team
JOURNAL #TWO [PRJ701]
Data Team
Team Structure
The scope of the project is such that it will require resources and expertise from members in each department, consequently, the newly formed data team will be interdisciplinary. This is a logical decision, ultimately the aims are to meet the reporting needs of each organisational unit. Furthermore, key individuals from these departments will have greater clarity with regards to what information is being collected, and by what applications through the business lifecycle.
The ‘Data Team’ will operate under the SCRUM methodology, the periods of the sprints have yet to be determined, likewise, the format of the daily meetups to assess progress is yet to be finalised. This format is being utilised to allow the team to meet collective and individual objectives and key results (OKRs).
Data
Although still in the planning stage, a cloud-based data warehouse provider is the preferred option for deployment to store and manage the data sourced from the various corporate applications and social media apps. It is anticipated that a process of data cleansing will be required before it is capable of supporting business analytics queries and possible data marts for the separate and distinct departmental groups.
Data Pipeline Summary
Several solutions are being explored that to solve the problem, these are:
- The ‘Traditional’ pipeline
- The ‘Light’ pipeline
- The ‘Hybrid’ pipeline
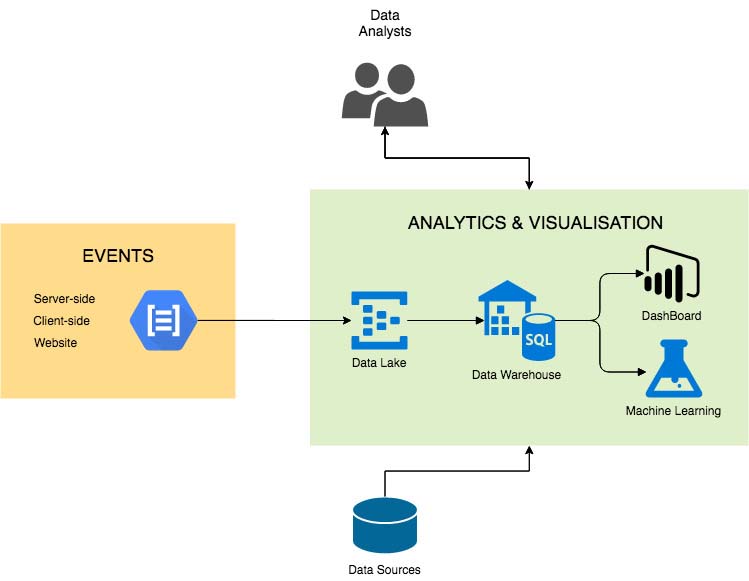
The ‘traditional’ and ‘hybrid’ pipelines include a ‘Data Lake’, used for the long term storage of the raw data, further benefits include future-proofing, particularly with the ‘hybrid’ model. The benefits of the traditional model are that it provides a single source of truth and scales well if considering ‘big data’.
There are several advantages to a ‘light’ pipeline, it can hide some of the complexity whilst simplifying the extract, transform and load (ETL). There are further business benefits which include less effort and reduced CapEx upfront.
The following diagram is a high level overview of the problem:
Business Intelligence Application Testing
The ultimate goal of the project is to display business-ready data capable of aiding the company’s decision-making process and to gain improved clarity and insights over the operational systems. There are several applications in the discussion, testing is taking place to determine which can best meet the business needs and allow for completion of the project. Research is ongoing to conduct a comparative analysis of the services to assist in the decision making process.
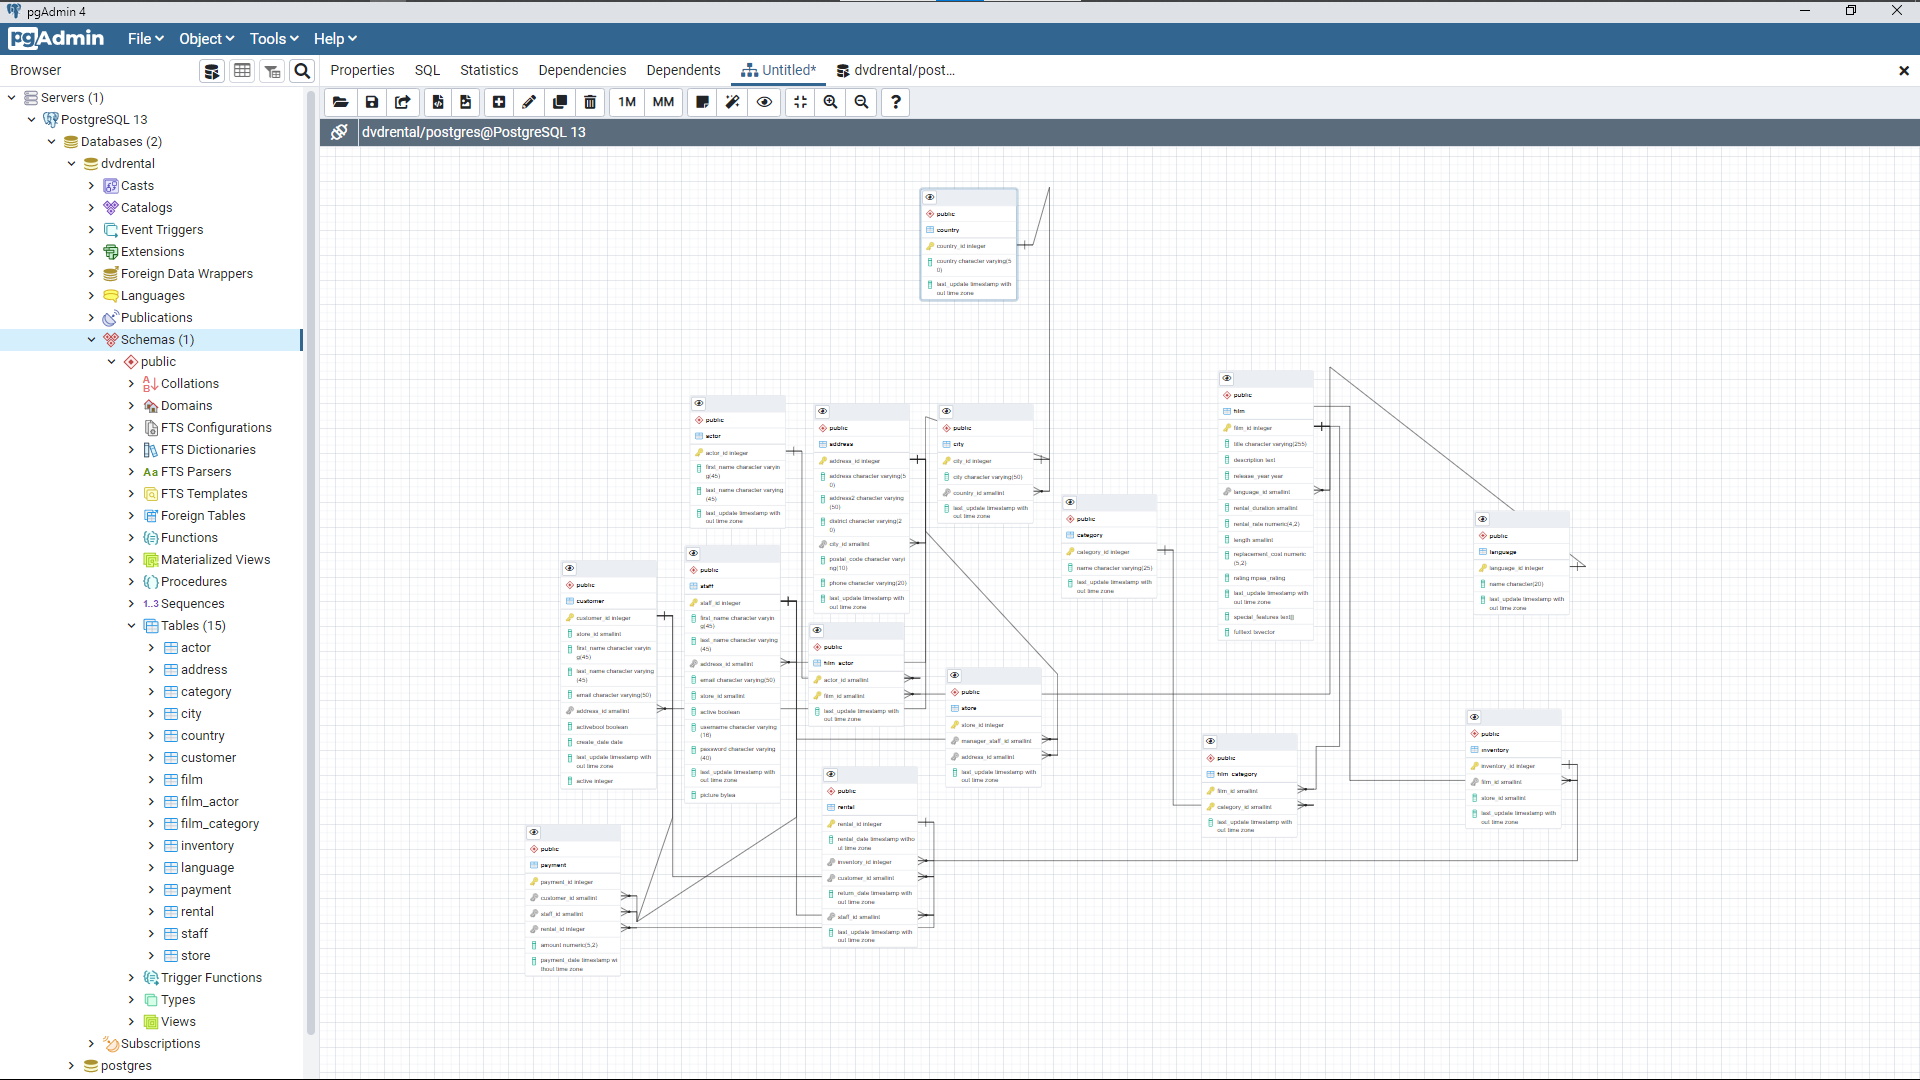
PostgreSQL
Effective testing of these systems required the creation of a local database instance, PostgreSQL was chosen as it is utilised within the company. A test database was installed from a backup and a physical diagram was generated and studied to allow for queries to be written that could be used later for the meaningful visualisation of the results:
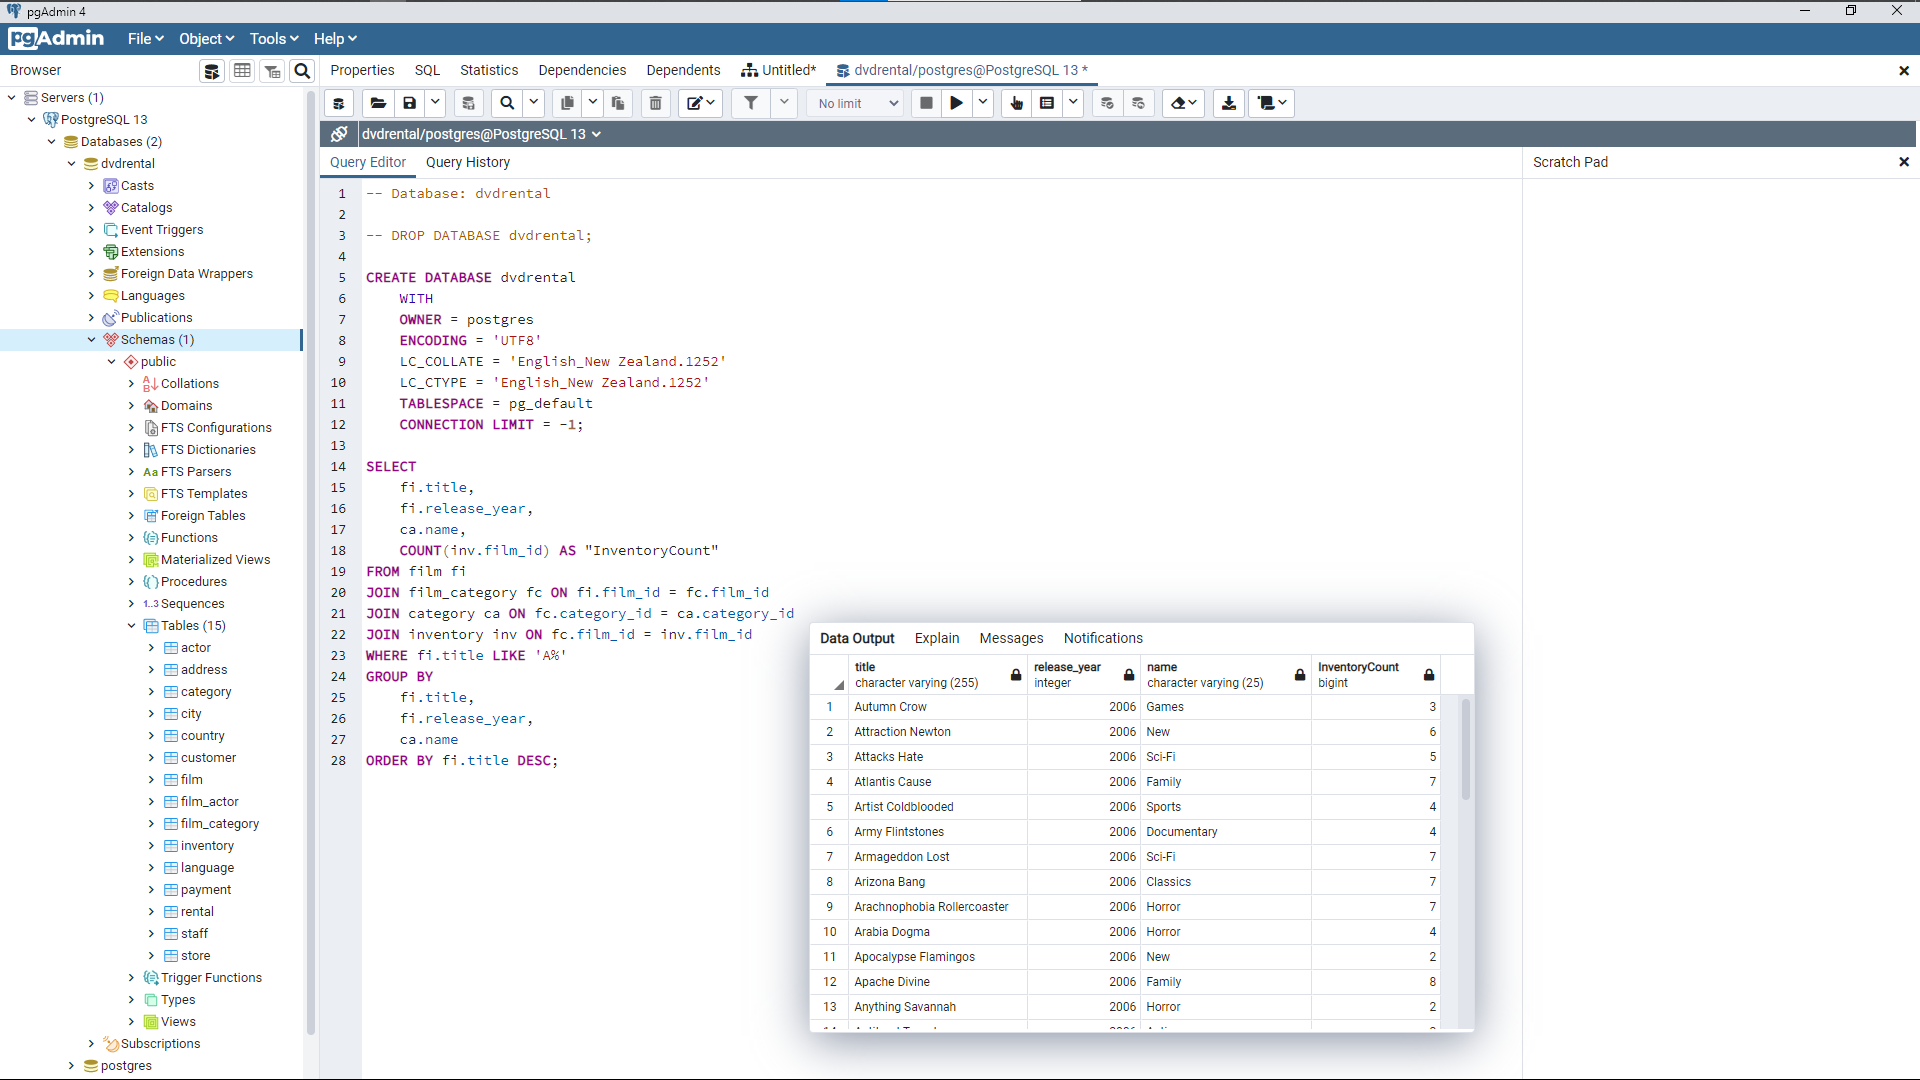
The following query was created and tested that could be deployed in the BI applications:
Microsoft Power BI
Power BI was tested against the local database instance first. This is a popular business analyst tool and is feature-rich. The free desktop version contains an array of functionality and once a connection was made to the localhost database, the query could be run in Power BI and testing could be performed of the various charts and graphs.
It is often the case with these business intelligence tools that the end-users are not familiar with SQL, so with testing of all these tools, the query results were replicated using the GUI features to compare the speed and ease at which results could be generated. Experience with SQL means that this method can create data visualisation more quickly, however, the GUI features are more than up to the task.
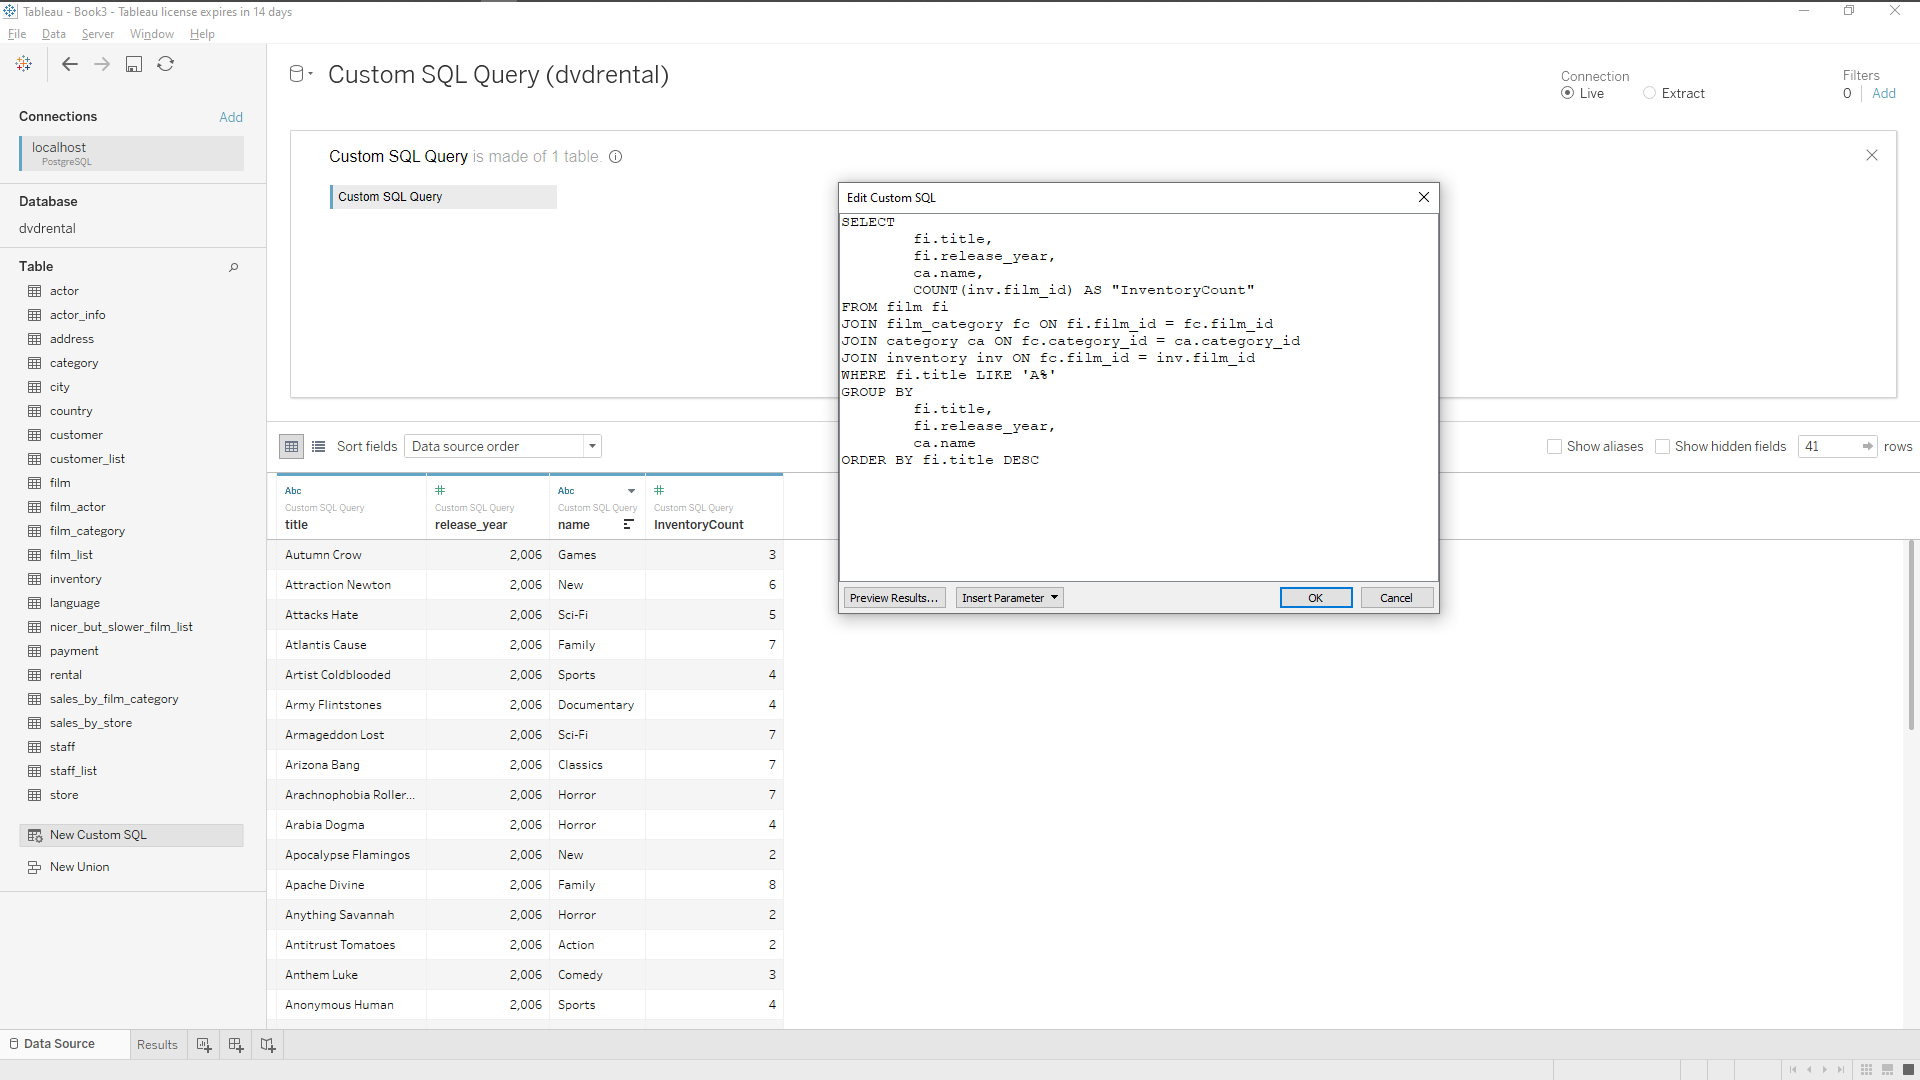
Tableau
Tableau was also tested against the local database instance. Testing of the product extended from the Tableau desktop application and analytics to the cloud and publishing features that form part of the 14 free trial. The publishing of data can be restricted to users with an account or can be made publicly available through the assigned public business URL.
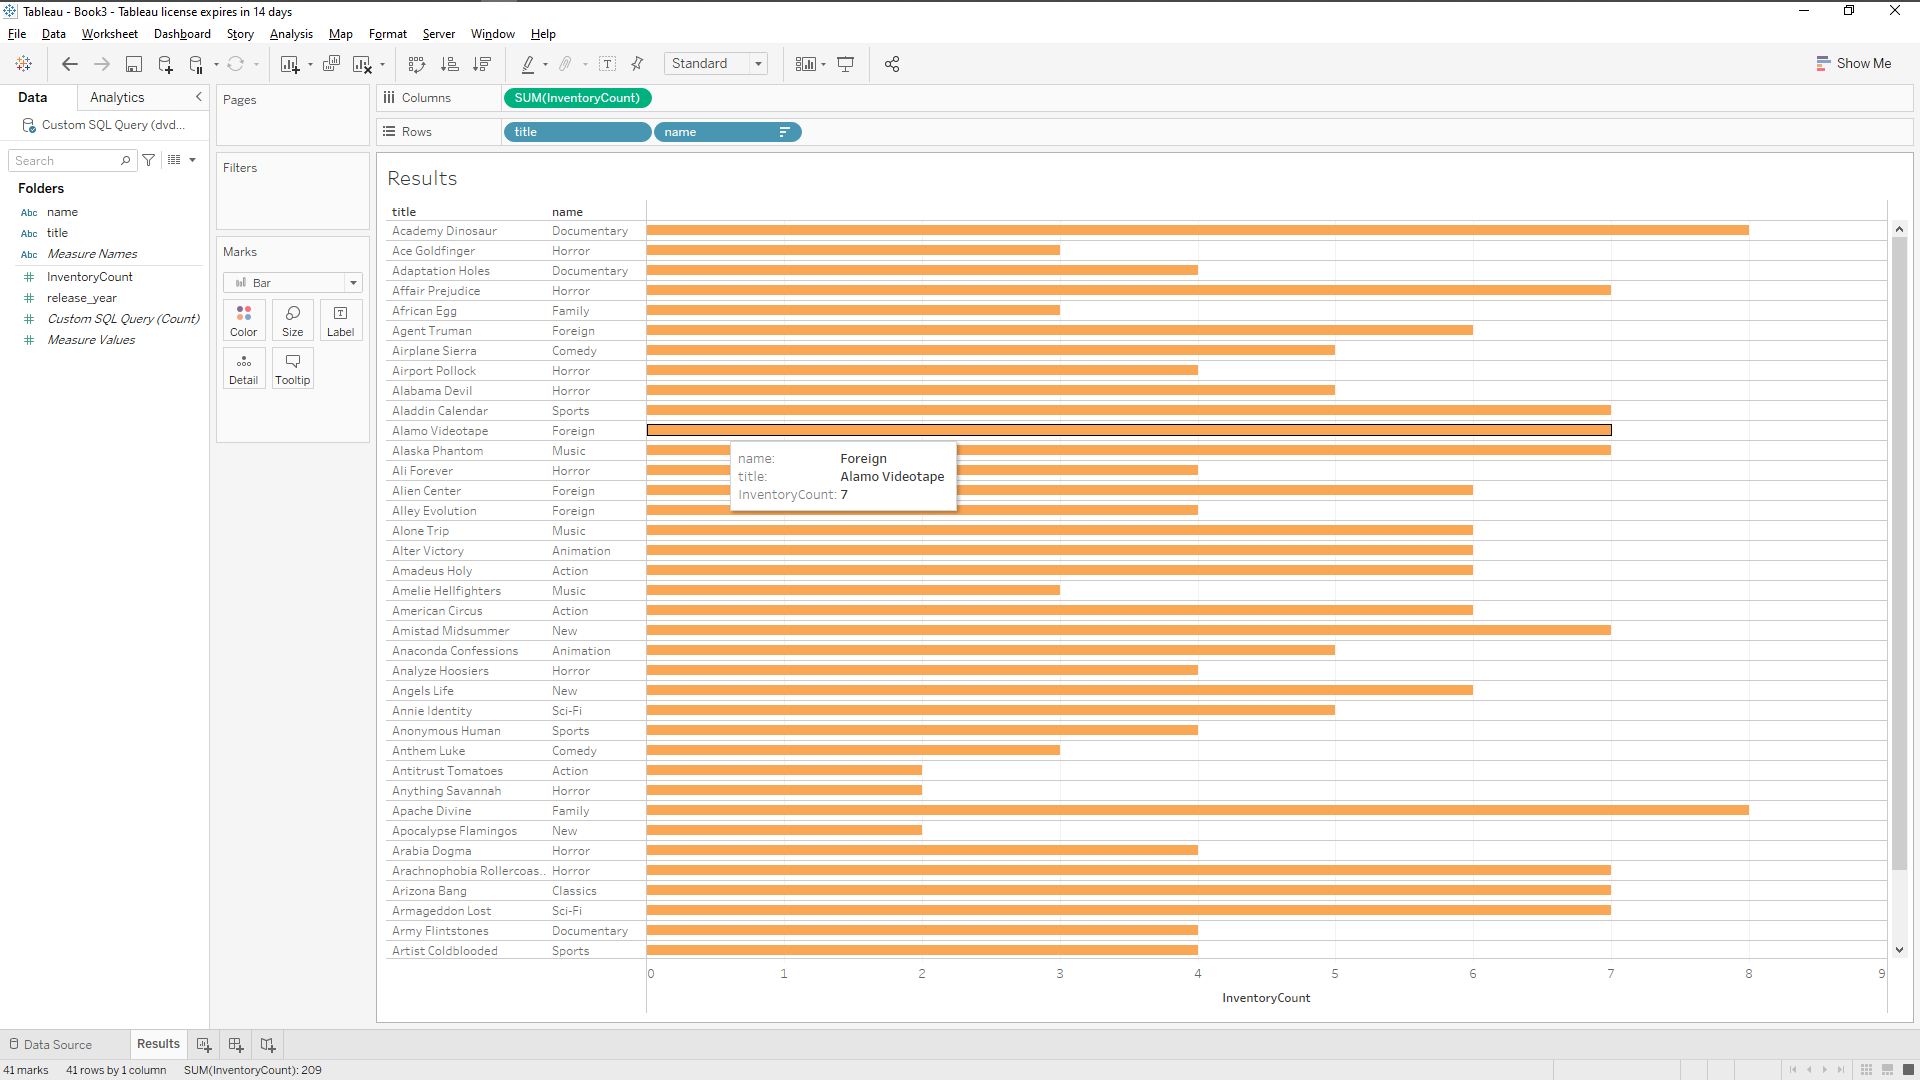
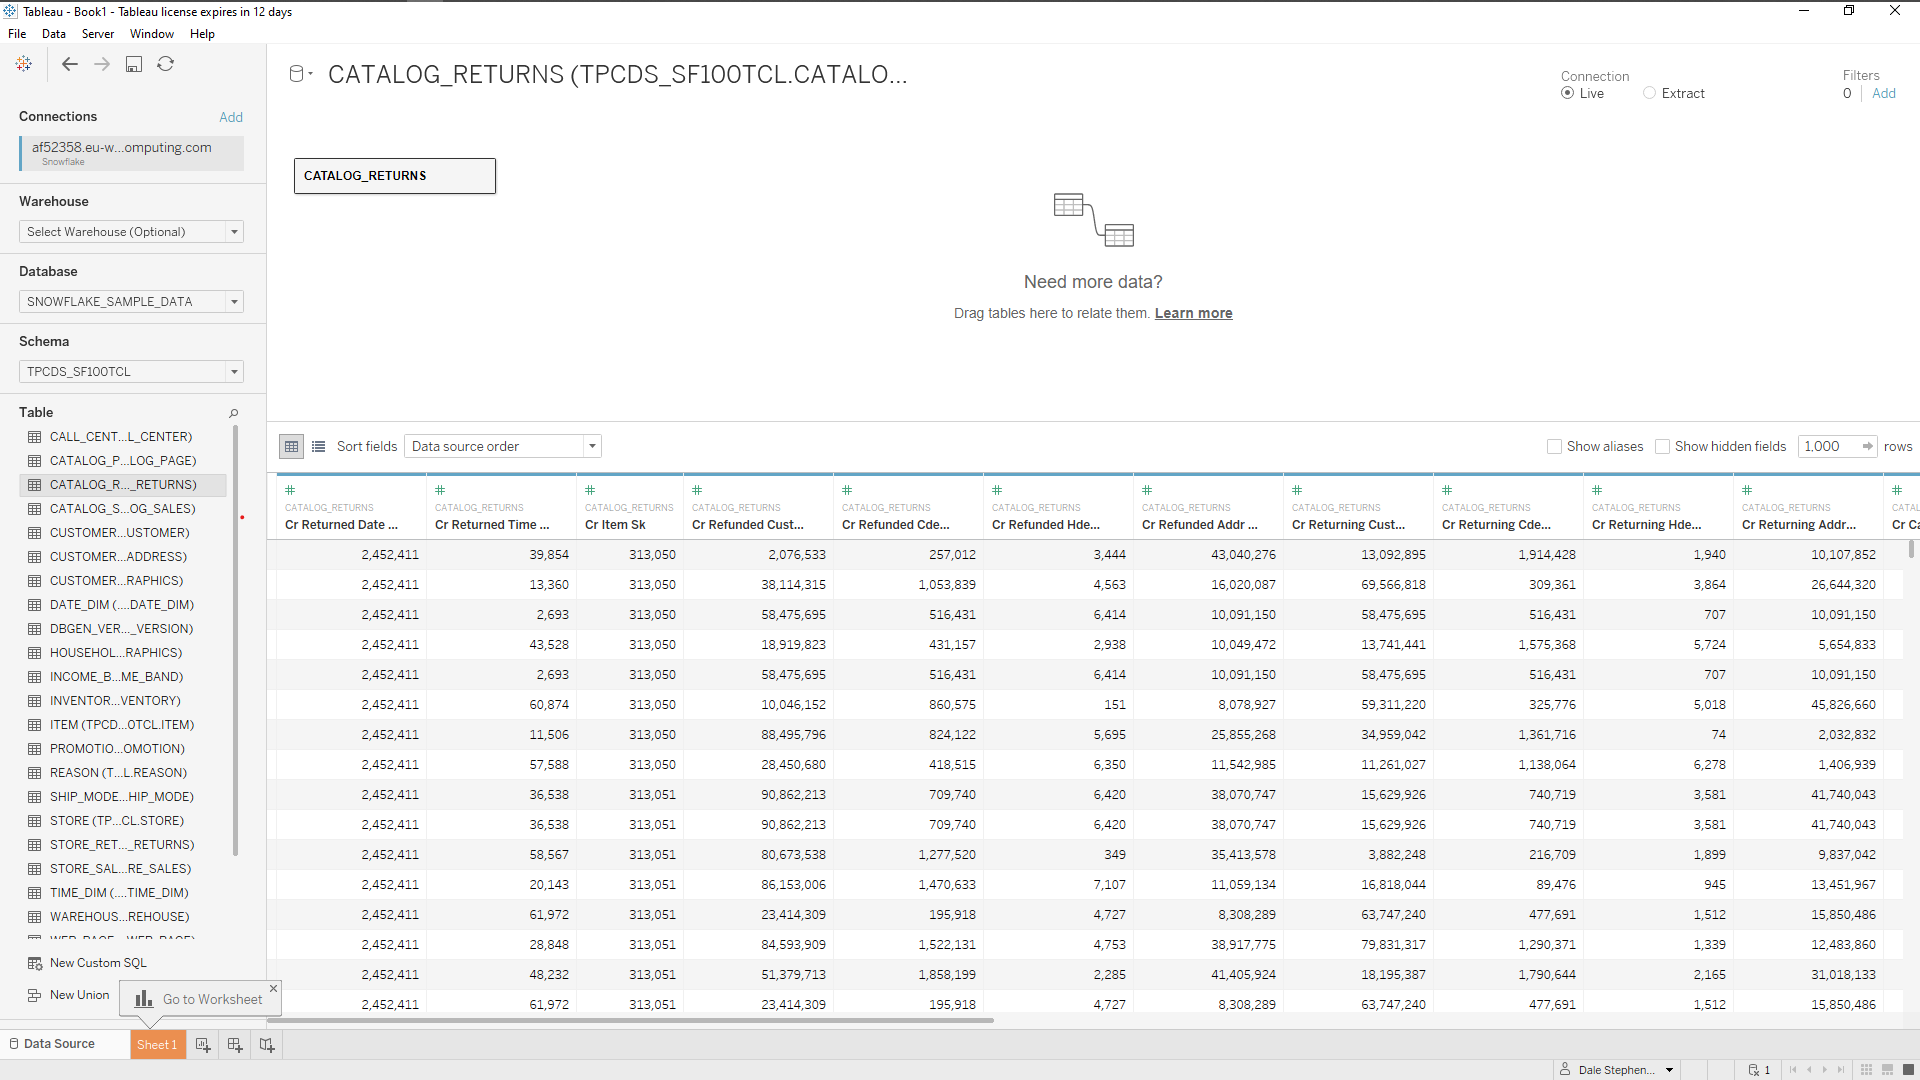
The following screenshot shows display the results of the query after a connection was made with the localhost database instance:
The following screenshot shows the results of the data retrieved by the select query and manipulated using the visualisation tools:
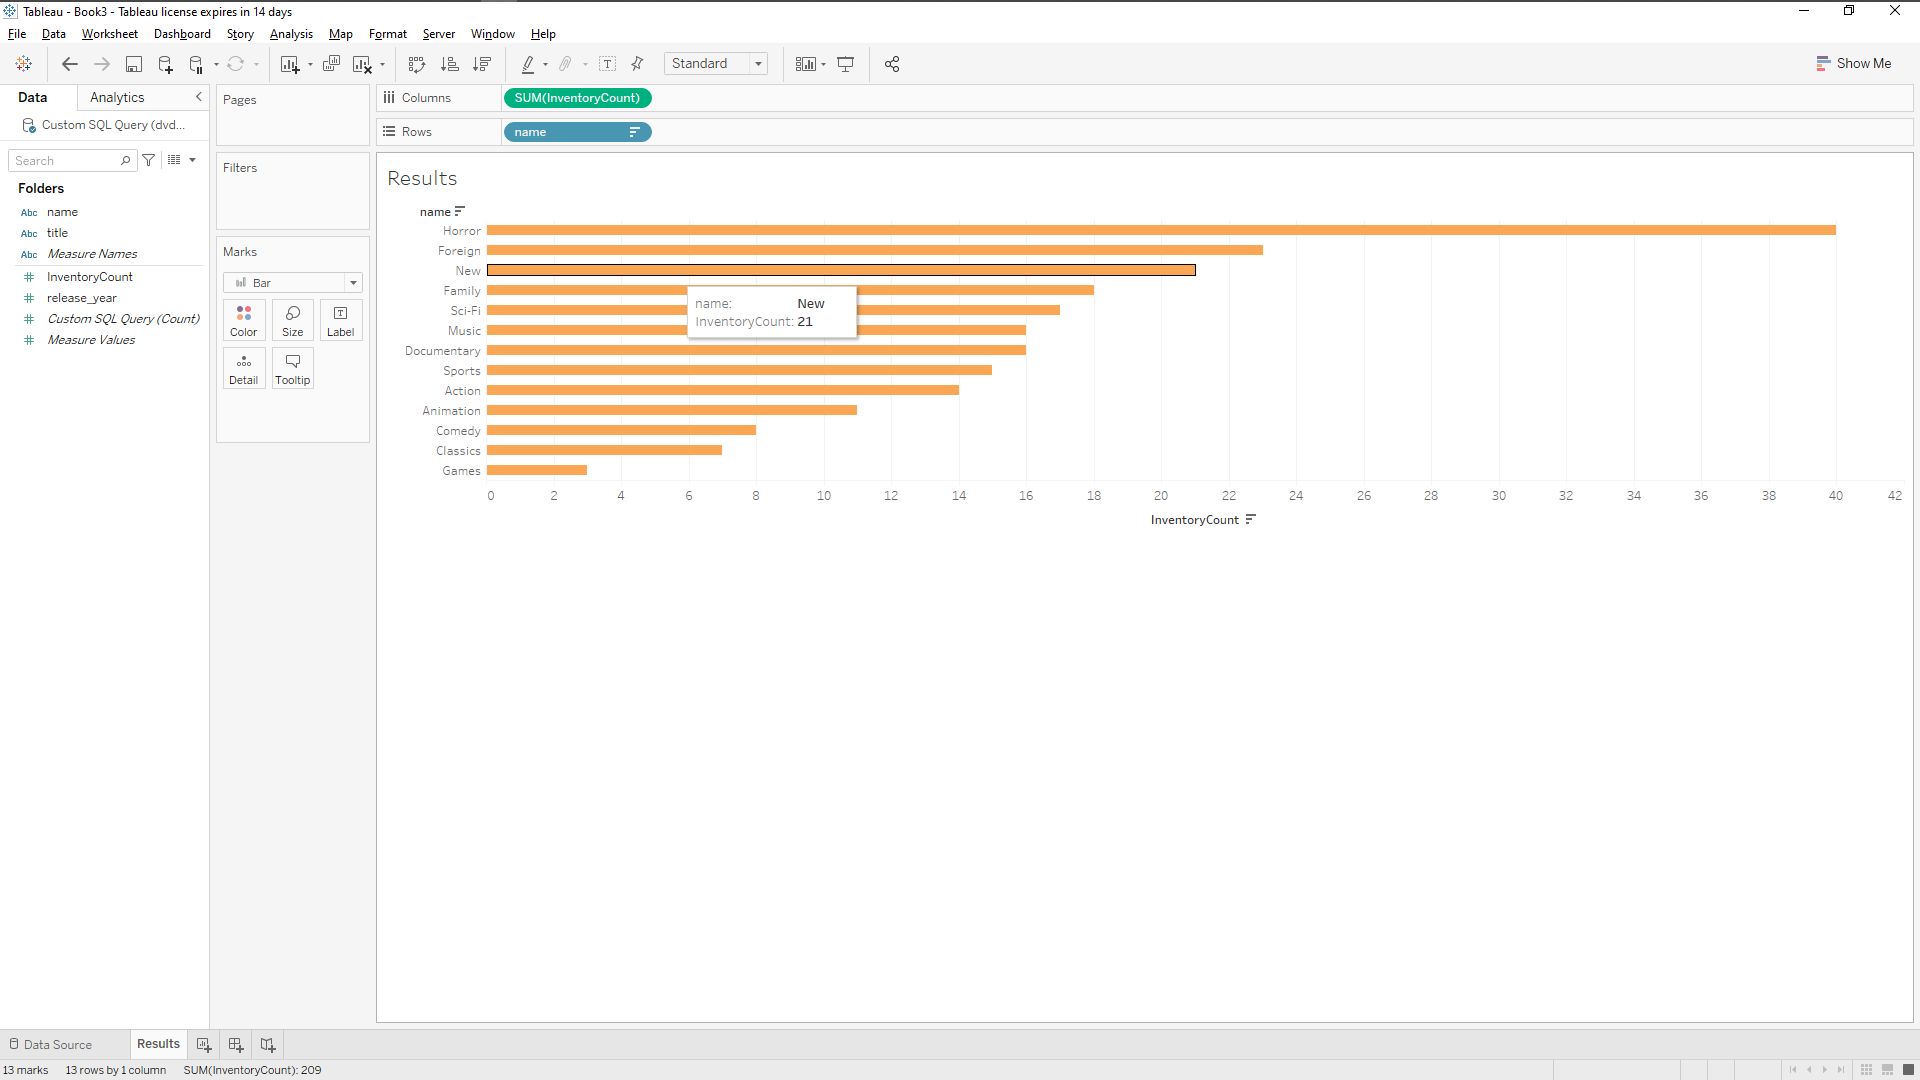
The data retrieved from the database was further manipulated to display the categories only, and not the instances contained within the categories:
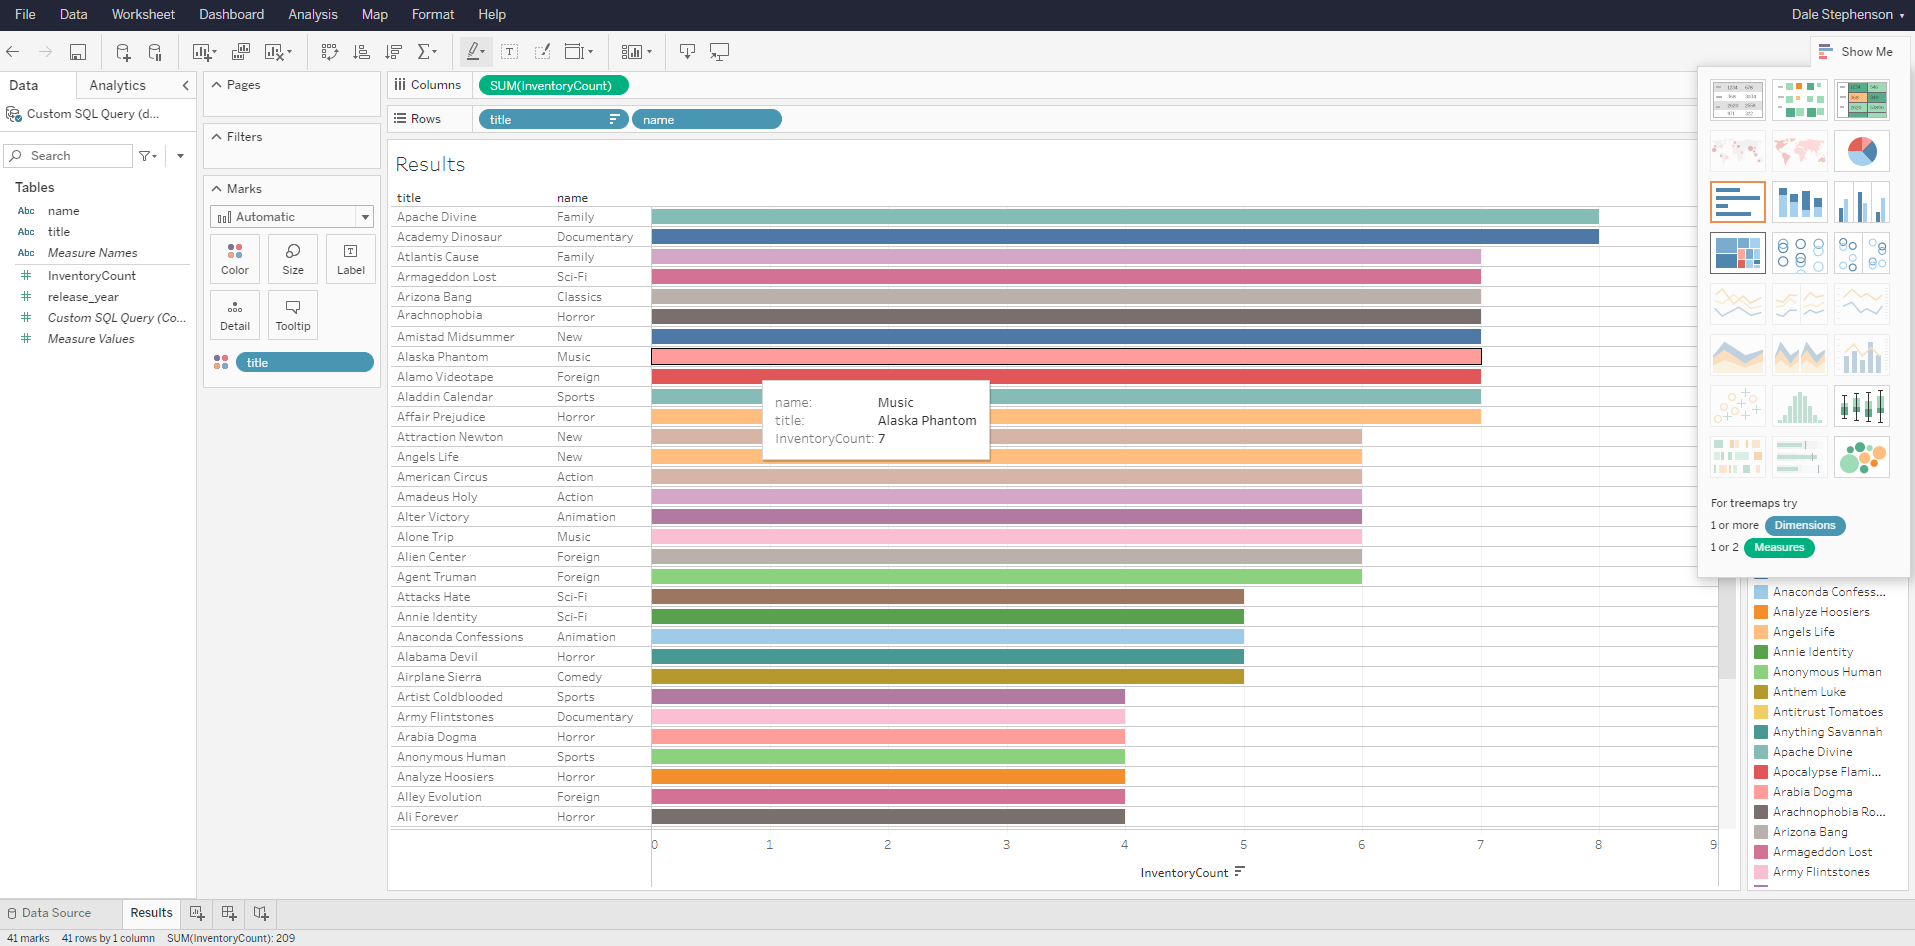
This final slide concerning Tableau is of the cloud-based version that can be accessed through a web browser, the data visualisation was further manipulated to make it more readable for business users. The functionality mimics that of the desktop version of the product, which makes moving between the two very easy:
Snowflake & Metabase
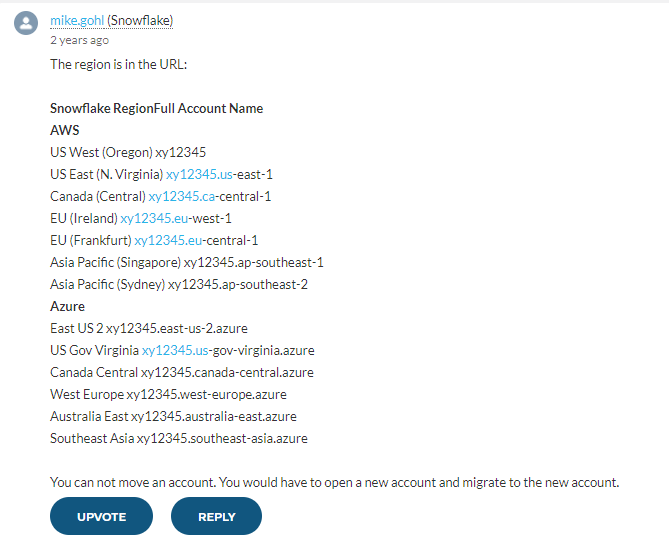
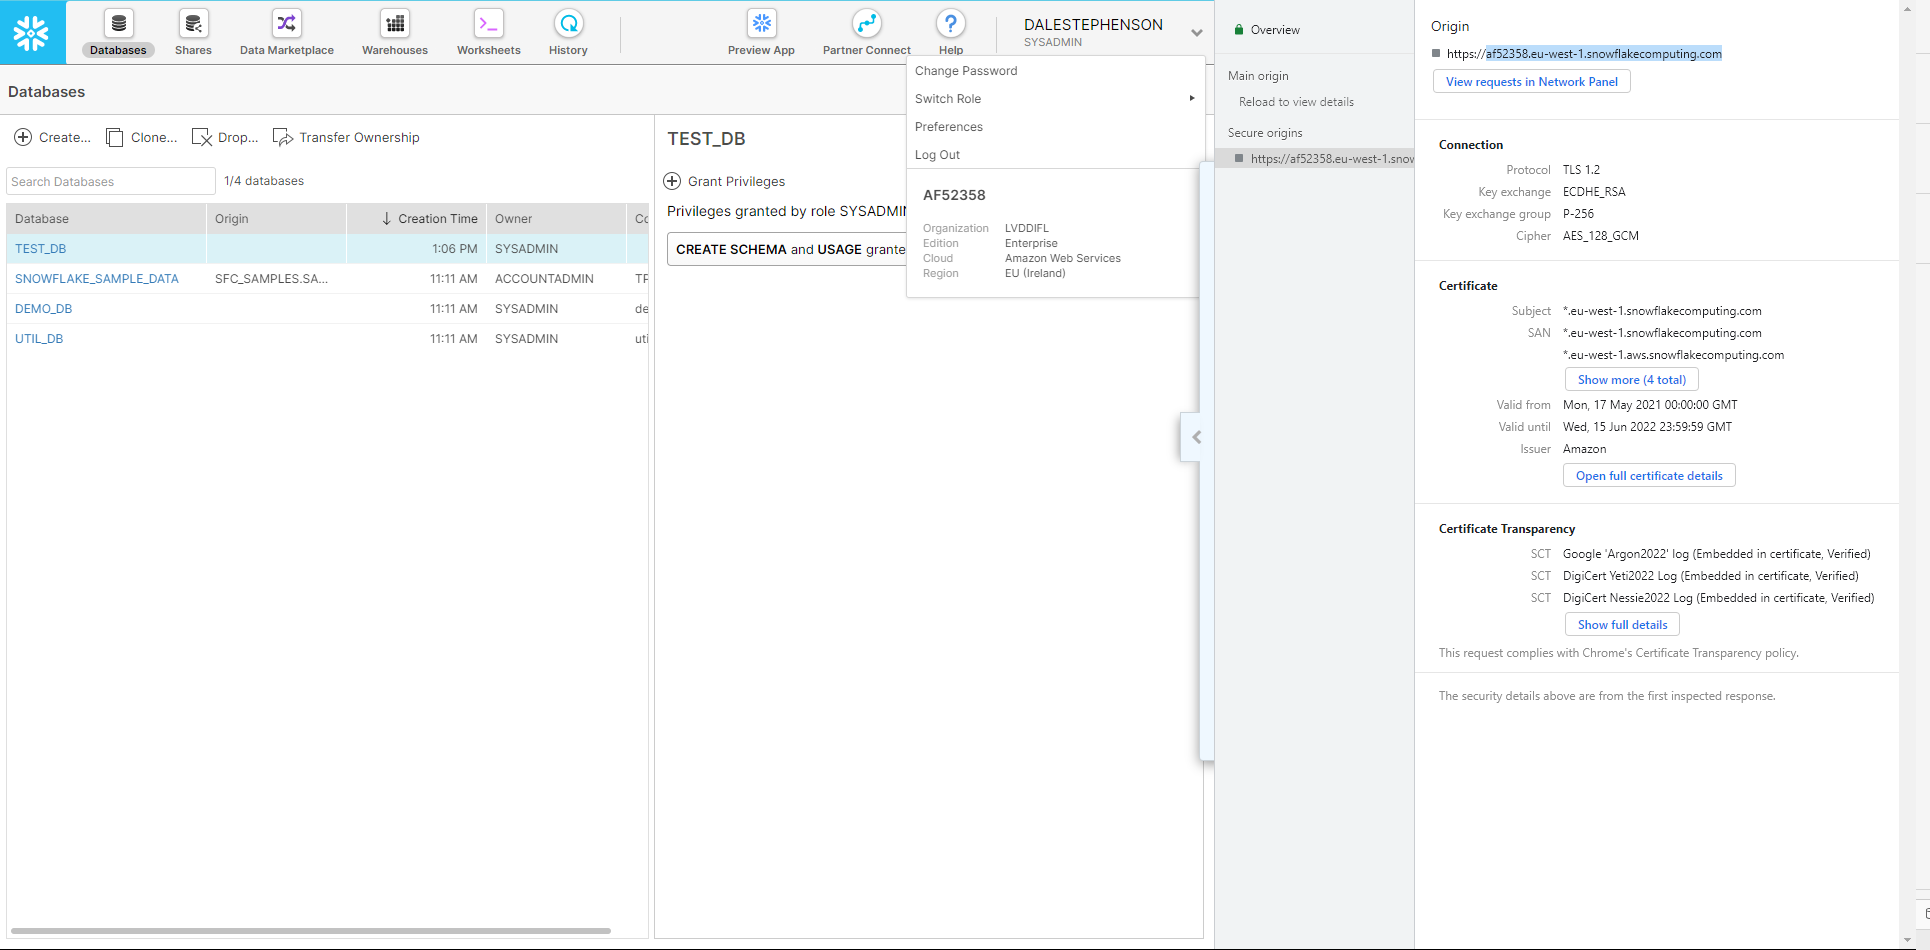
Systems testing went one step further with a Snowflake trial, which acted as a test instance of a data warehouse. Snowflake is a cloud-based service that includes a test database, the benefit of the service is it allows a business decision to be made with regards to the geolocation of business data. This is essential as it allows the company to choose a location that allows it to meet its obligations under the GDPR. As a result the test instance established the database in EU (Ireland) eu-west-1:
A connection was established between Snowflake and Metabase, in this case, Snowflake generates a secure origin to connect the database with the visualisation tool, https://af52358.eu-west-1.snowflakecomputing.com, login credentials are necessary.
Metabase is also a cloud-based service that also has an open-source application should an organisation wish to support and manage its instance locally. The cloud-based version was deployed as part of the test as it is the most likely solution for this use case:
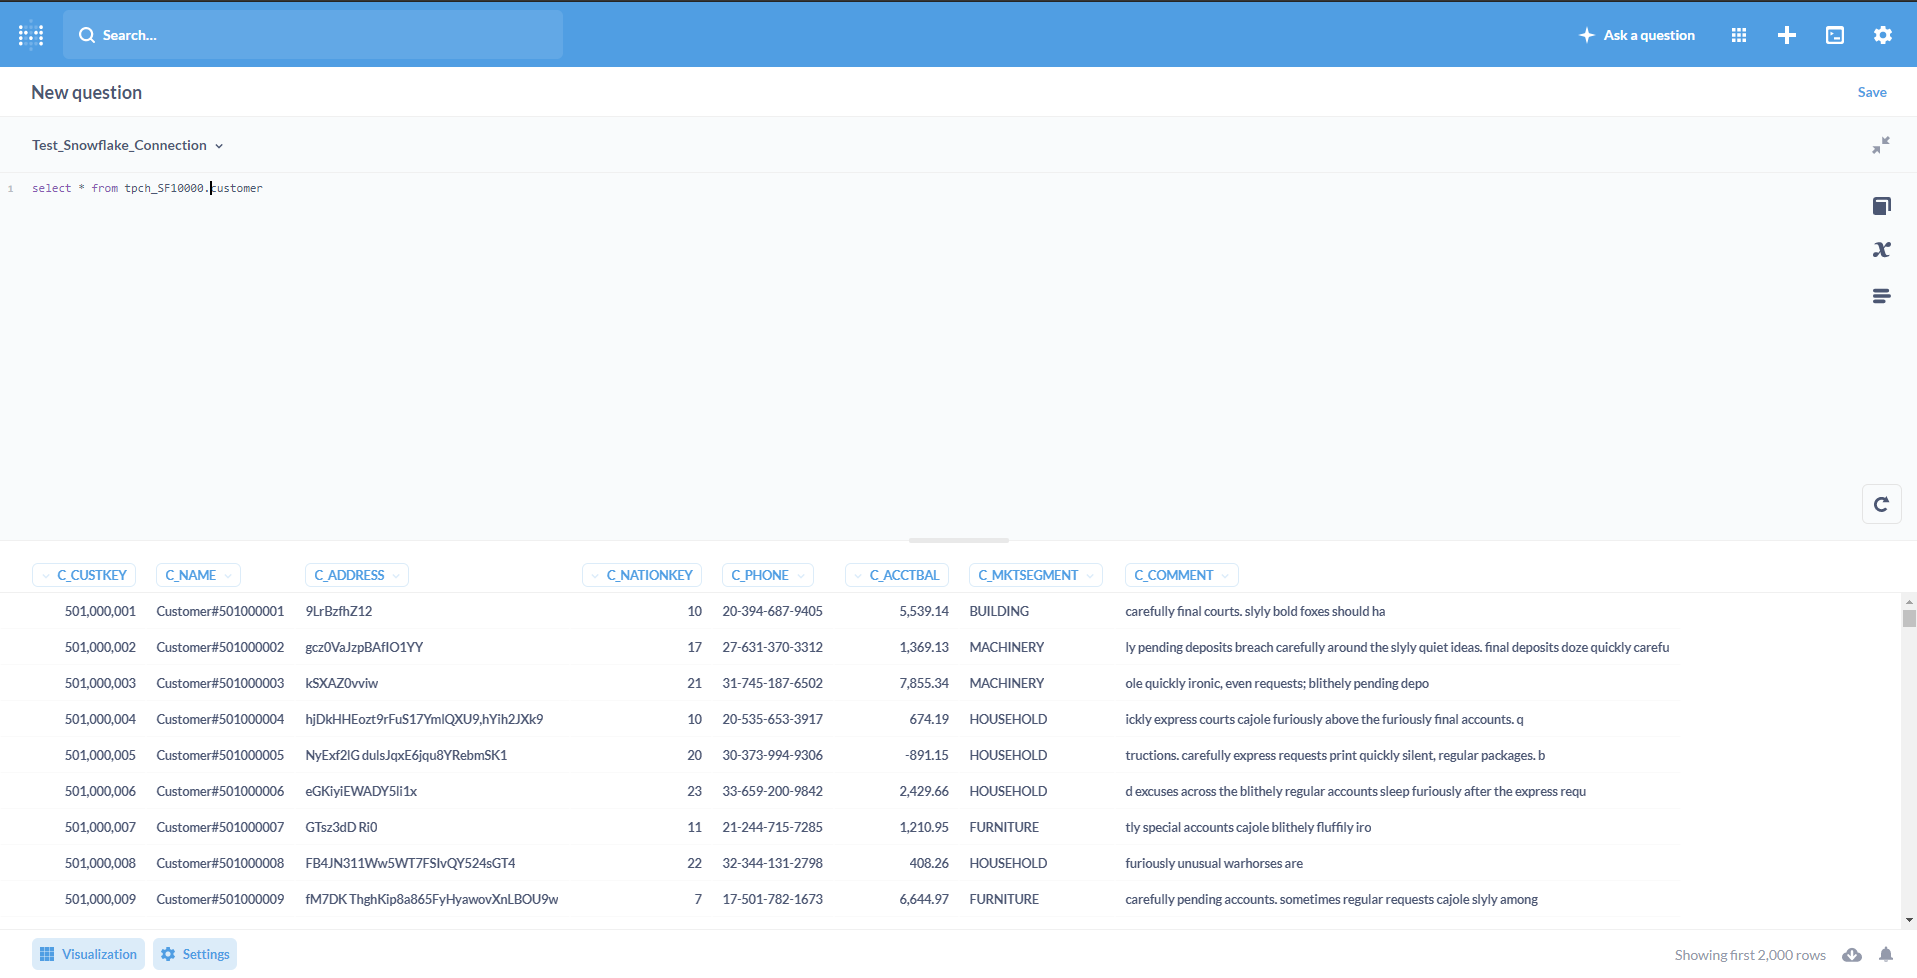
Once a connection was established the data could be manipulated. In this instance a new query was created based on the in-built data set as follows:
The following screen shot shows the connection in Metabase, tested with a simple select query:
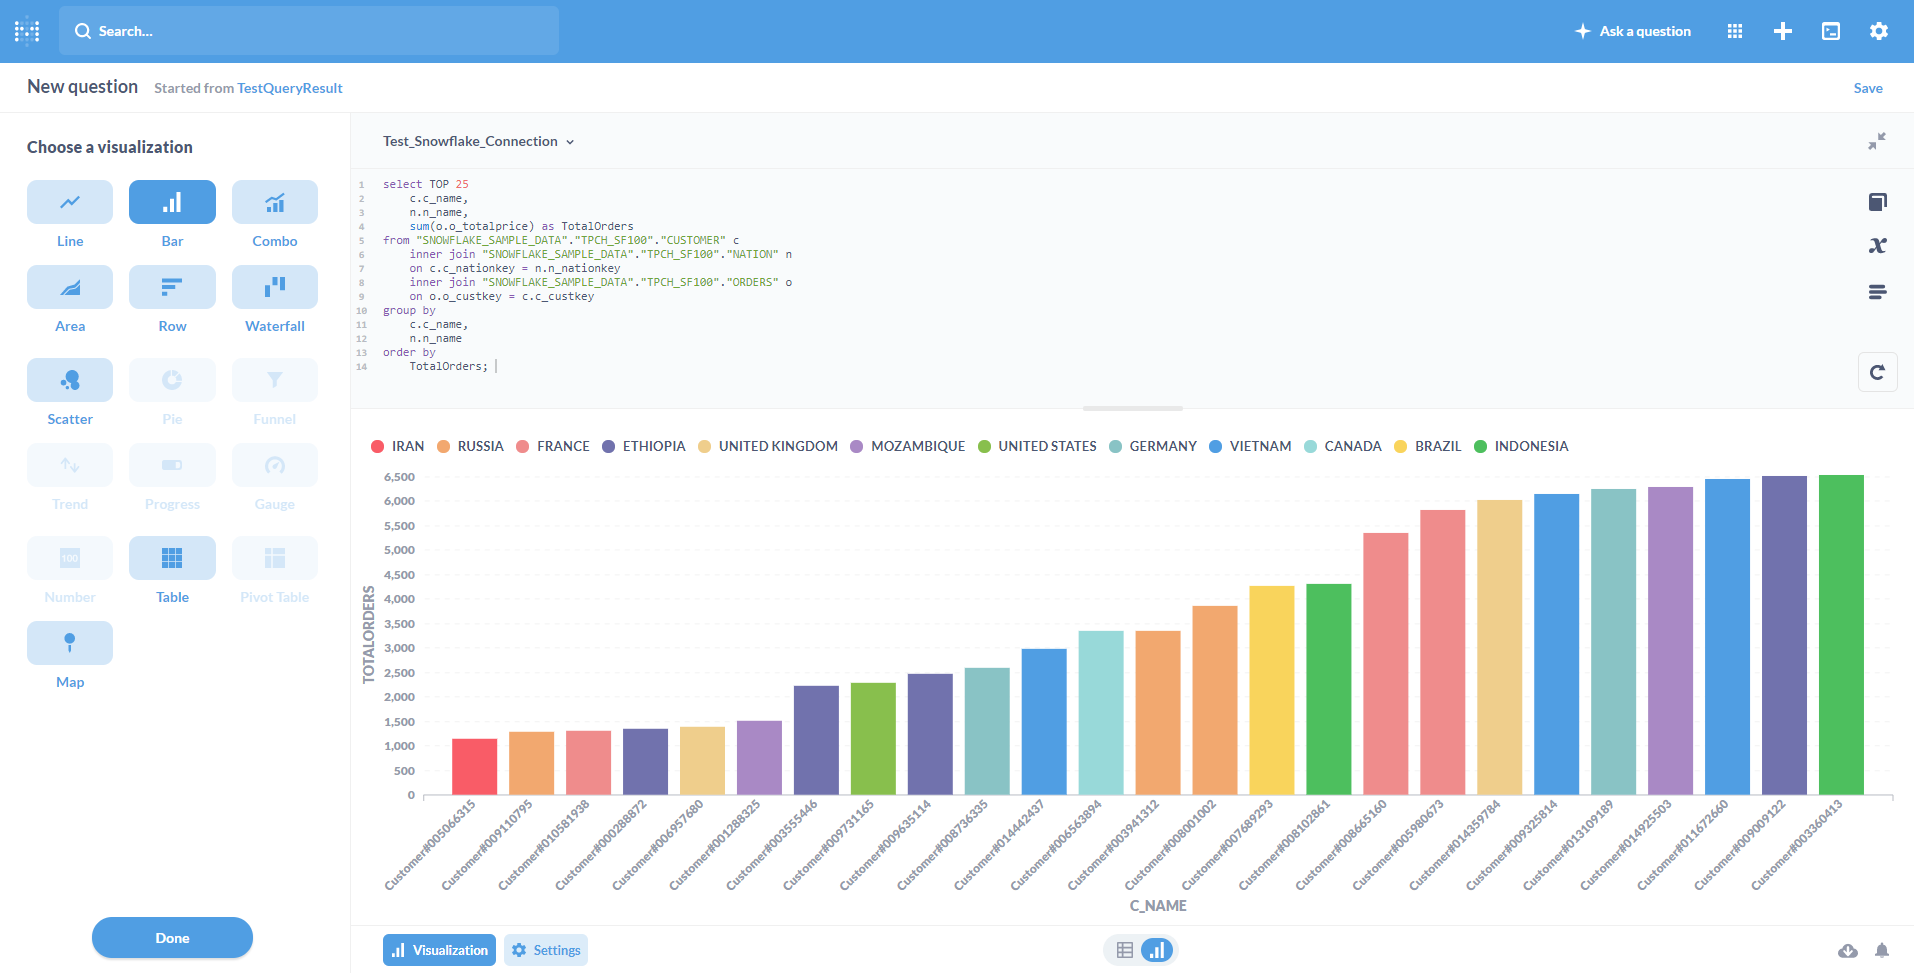
To better test the two systems a query was generated that would create a more complex data set to test:
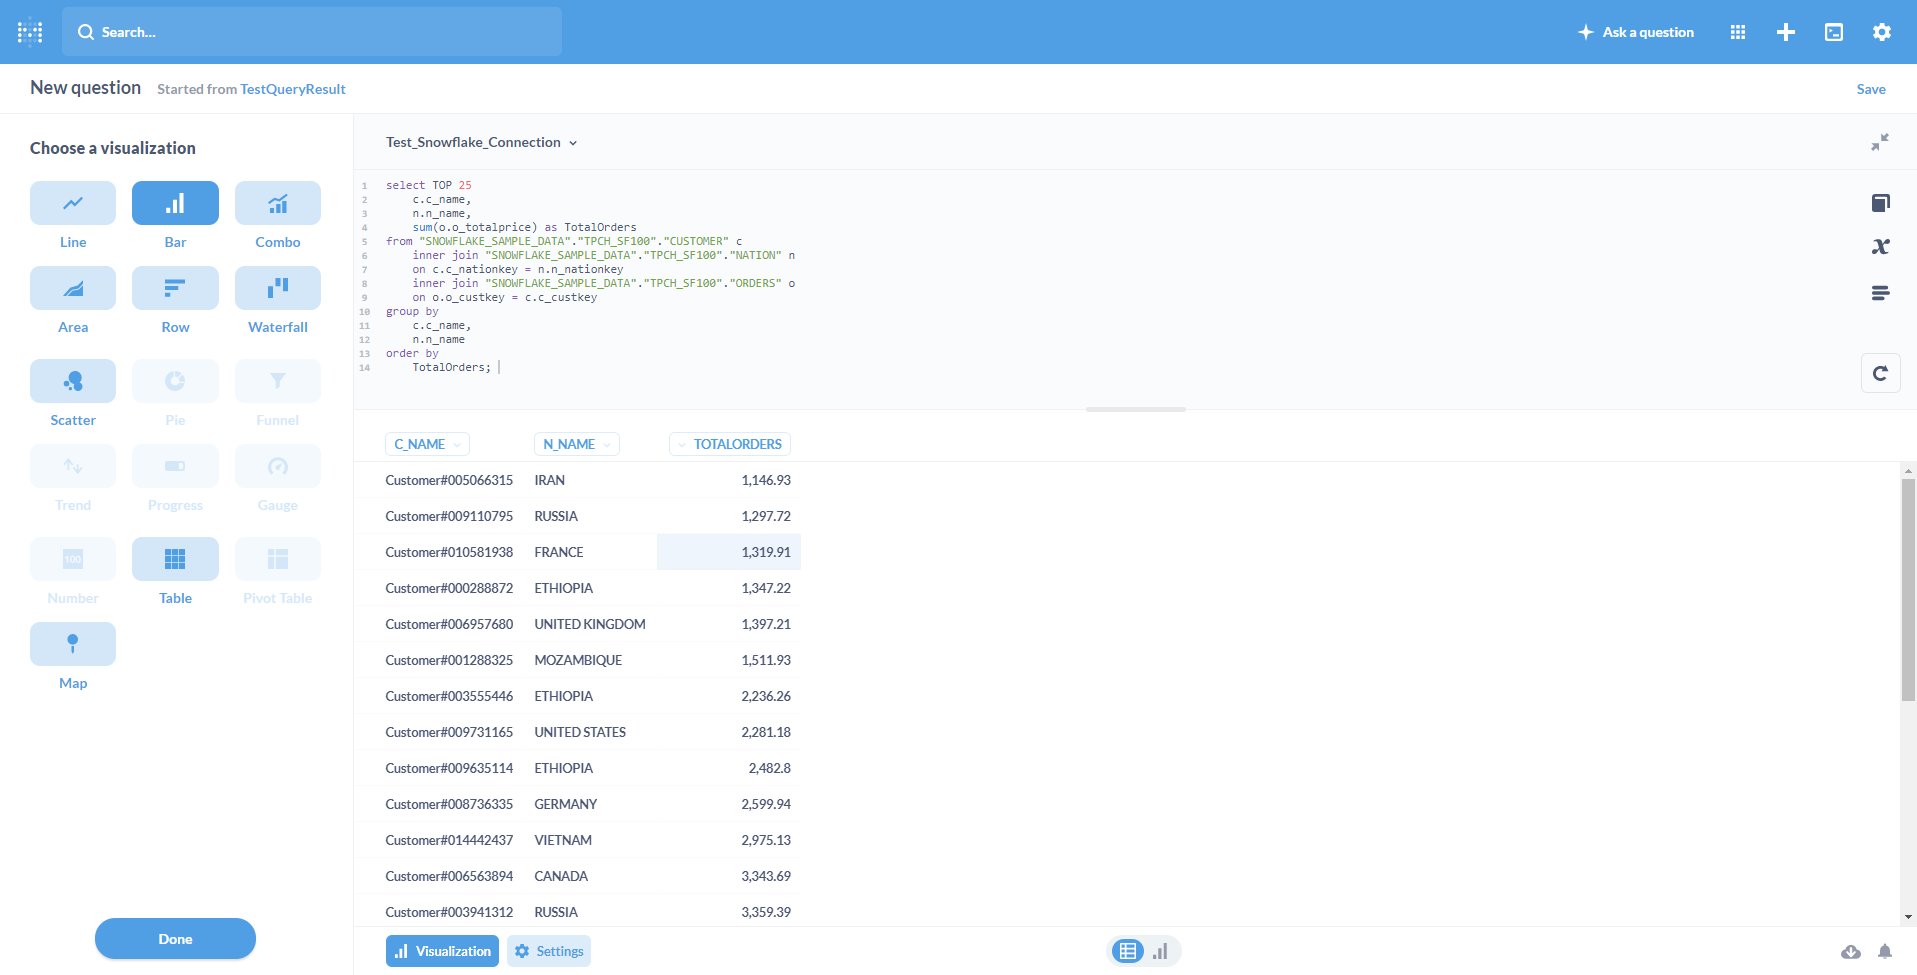
The data was manipulated in the results displayed as follows:
Metabase includes a dashboard that can be used to display multiple charts together that can be accessed collectively and analysed by business users and analysts. At this stage of testing, Metabase does not appear to be as feature-rich as either Power BI or Tableau. A complete comparison analysis of these three products will take place over the next week or two.
Data Visualization - Microsoft Power BI. (n.d.). Retrieved August 9, 2021, from https://powerbi.microsoft.com/en-us/
Group, P. G. D. (2021, August 8). PostgreSQL. PostgreSQL. https://www.postgresql.org/
Metabase. (n.d.). Retrieved August 9, 2021, from https://www.metabase.com/
Tableau: Business Intelligence and Analytics Software. (n.d.). Tableau. Retrieved August 9, 2021, from https://www.tableau.com/
The Data Cloud - Snowflake - Enable the Most Critical Workloads. (n.d.). Snowflake. Retrieved August 9, 2021, from https://www.snowflake.com/